

GTX 1650 vs 1050 Ti : Entry-Level GPU Showdown for Gamers and Creators
Looking for the best entry-level to mid-range GPU? This article compares the GTX 1650 vs GTX 1050 Ti, covering gaming performance, 3D rendering, and GPU-accelerated workloads. Discover which card offers better value, smoother gameplay, and faster rendering, helping you choose the right GPU for your budget and needs.
GTX 1650 vs GTX 1050 Ti – Background Comparison
| Brand | Series | Model | Release Year | Official Positioning | Market Price (USD) |
|---|---|---|---|---|---|
| NVIDIA | GeForce | GTX 1650 | 2019 | The GeForce GTX 1650 delivers strong, efficient performance based on NVIDIA’s Turing architecture, providing a solid boost for popular and modern games—an easy upgrade for better gaming. | $149 |
| NVIDIA | GeForce | GTX 1050 Ti | 2016 | The GeForce GTX 1050 Ti offers reliable, power-efficient performance built on NVIDIA’s Pascal architecture, delivering a noticeable boost in popular and modern games. | $139 |
NVIDIA GTX 1650 vs GTX 1050 Ti – Specifications Comparison
The GeForce GTX 1650, based on NVIDIA’s Turing architecture, offers a noticeable performance boost over the GTX 1050 Ti. With 16.7% more CUDA cores, higher clock speeds, and ~39% greater FP32 performance, it delivers smoother gameplay and better efficiency while keeping the same 4GB GDDR5 memory and 75W power draw. This makes the GTX 1650 a significant upgrade for modern gaming without increasing power requirements.
Core Specs Comparison between GTX 1650 vs GTX 1050 Ti
| Specification | GTX 1650 | GTX 1050 Ti | 1650 Improvement / Gain |
|---|---|---|---|
| GPU Model | NVIDIA GeForce GTX 1650 | NVIDIA GeForce GTX 1050 Ti | Newer generation |
| Architecture | Turing (TU117) | Pascal (GP107) | Architecture upgrade |
| CUDA Cores | 896 | 768 | +16.7% |
| Memory Type | GDDR5 | GDDR5 | — |
| Memory Capacity | 4GB | 4GB | — |
| Memory Bandwidth | 128 GB/s | 112 GB/s | +14.3% |
| Core Frequency (Base / Boost) | 1485 / 1665 MHz | 1290 / 1392 MHz | +15–20% higher clocks |
| TDP (Power Draw) | 75W | 75W | No change |
| Interface | PCIe 3.0 x16 | PCIe 3.0 x16 | — |
| FP32 Performance | ~2.98 TFLOPS | ~2.14 TFLOPS | ≈ +39% |
| Tensor Cores | None | None | — |
| PCIe Interface | PCIe 3.0 | PCIe 3.0 | — |
The GeForce GTX 1650 outperforms the GTX 1050 Ti with NVIDIA’s Turing architecture, offering improved shader efficiency, Turing NVENC for higher-quality video encoding, and Variable Rate Shading for optimized rendering. It delivers smoother 4K and multi-monitor performance, better support for modern APIs like DirectX 12 Ultimate and Vulkan 1.2, and full NVIDIA gaming features such as G-SYNC, Ansel, and Highlights—making it a clear upgrade for modern gaming.
Advanced Feature Comparison between GTX 1650 vs GTX 1050 Ti
| Feature | GTX 1650 | GTX 1050 Ti | 1650 Improvement / Gain |
|---|---|---|---|
| GPU Architecture Features | Turing shaders with improved efficiency and concurrent INT/FP execution | Pascal shaders | Better efficiency, modern Turing enhancements |
| Video Encoding (NVENC) | Turing-based NVENC with HEVC 10-bit support | Pascal NVENC | Improved encoding efficiency & quality |
| Display Support | 4 × DisplayPort 1.4, 1 × HDMI 2.0b, 1 × DVI | 3 × DisplayPort 1.4, 1 × HDMI 2.0b, 1 × DVI | Supports more displays simultaneously |
| VR & Gaming APIs | DirectX 12 Ultimate, Vulkan 1.2, OpenGL 4.6 | DirectX 12, Vulkan 1.1, OpenGL 4.5 | Better API support, future-proof |
| Adaptive Shading / Graphics Features | Variable Rate Shading (VRS) support | Not supported | Enables performance-optimized rendering in modern titles |
| Memory Compression / Efficiency | Turing memory compression improves bandwidth utilization | No advanced compression | More efficient memory usage, higher effective bandwidth |
| Multi-Monitor / 4K Performance | Better 4K and multi-monitor handling | Lower 4K performance | ~20–30% smoother in high-res setups |
| Gaming Technology Support | NVIDIA G-SYNC, Ansel, Highlights | G-SYNC, Ansel (limited) | Full Turing enhancements for modern games |
GTX 1650 vs GTX 1050 Ti Performance Across Different Scenarios
Artificial Intelligence Testing
The GeForce GTX 1650 and GTX 1050 Ti are popular entry-level GPUs for gaming and light AI workloads. Geekbench ML provides a standardized benchmark to evaluate machine learning performance, including single-precision, half-precision, and quantized tasks. Comparing these two GPUs with Geekbench ML helps highlight the differences in efficiency, throughput, and suitability for lightweight AI inference and GPU-accelerated computing tasks.
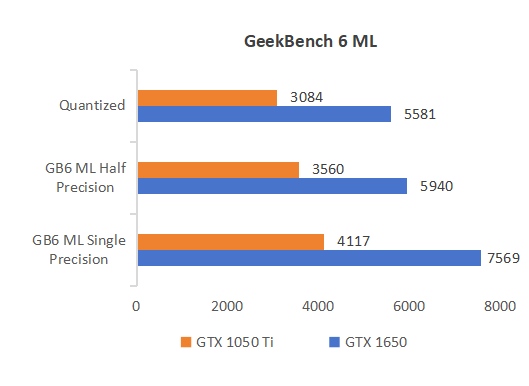
The Geekbench ML benchmark shows that the GTX 1650 outperforms the GTX 1050 Ti by roughly 70–85% across single-precision, half-precision, and quantized AI tasks, delivering significantly higher efficiency and throughput for lightweight machine learning and GPU-accelerated workloads.
Gaming Performance
The GeForce GTX 1650 and GTX 1050 Ti are both entry-level to mid-range graphics cards, mainly designed for 1080p gaming and light GPU workloads. Their performance varies across different resolutions, with the 1650 generally delivering higher frame rates and smoother gameplay compared to the 1050 Ti. Below is a bar chart comparing their performance across 1080p, 1440p, and 4K settings:
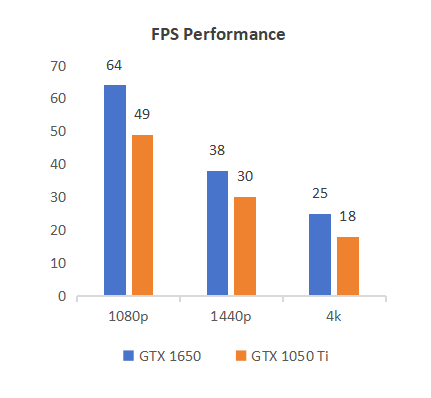
For 1080p gaming, the GTX 1650 offers a clear advantage over the GTX 1050 Ti, delivering approximately 25–35% higher FPS for smoother gameplay and more stable performance across most titles.
At 1440p, the 1650 still maintains a slight edge, though frame rates generally fall into the mid-to-low range, making medium settings the practical choice for higher-quality visuals.
At 4K or ultra-high resolutions, neither card is ideal; even with the 1650’s slight advantage, gameplay is often limited by low frame rates and reduced smoothness, highlighting that both GPUs are best suited for entry-level to mid-range gaming.
3D Rendering
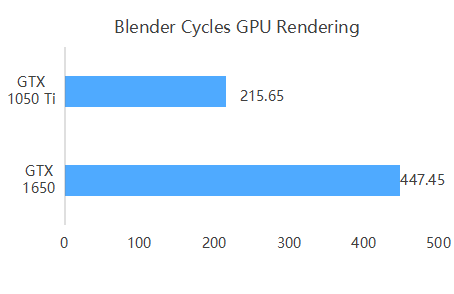
The GTX 1650 delivers significantly higher GPU rendering performance than the GTX 1050 Ti in Blender’s Cycles benchmark. With a score of around 447.45 versus 215.65 for the 1050 Ti, the 1650 achieves roughly 2.1× faster rendering, making it an excellent choice for 3D modeling, animation, and GPU-accelerated rendering workflows. However, with only 4 GB of VRAM on both cards, performance may be limited for large scenes or high-resolution 3D renders.
Price & Value: GTX 1650 vs GTX 1050 Ti
The GTX 1650 and GTX 1050 Ti are both entry-level to mid-range graphics cards, with relatively small price differences. The 1650 typically costs $10–$40 more than the 1050 Ti, representing a 7%–25% increase depending on retailer or marketplace. Considering its significantly higher performance in gaming, 3D rendering, and GPU-accelerated tasks, the GTX 1650 offers a better price-to-performance ratio, making it the preferred choice for budget-conscious gamers and creators seeking efficient entry-level GPU performance.
Price Comparison
| Platform / Retailer | GTX 1650 (USD) | GTX 1050 Ti (USD) | Price Difference (USD) | Price Difference (%) |
|---|---|---|---|---|
| Official MSRP | ~$149 | ~$139 | +$10 | +7% |
| Retail (Amazon / Newegg) | ~$149–$179 | ~$139–$159 | +$10–$40 | +7%–+25% |
| Secondary / Marketplace | ~$150–$200 | ~$140–$170 | +$10–$60 | +7%–+35% |
User Value-for-Money Feedback
User feedback indicates that the GTX 1650 delivers roughly 1.8–2.1× higher performance than the GTX 1050 Ti, particularly in gaming, 3D rendering, video editing, and GPU-accelerated workloads. For casual 1080p gaming or light GPU tasks, the GTX 1050 Ti provides adequate performance at a slightly lower cost; however, if better efficiency, smoother gameplay, and faster rendering are desired, the GTX 1650 is the superior choice for entry-level to mid-range users.
GTX 1650 vs GTX 1050 Ti – Pros & Cons
| Model | Pros | Cons |
|---|---|---|
| GTX 1650 | ✅ Significantly higher performance than GTX 1050 Ti in gaming, 3D rendering, video editing, and GPU-accelerated tasks ✅ Adequate for 1080p gaming at medium to high settings and moderate 3D/video workloads ✅ Better price-to-performance ratio for entry-level to mid-range users |
❌ Only 4 GB VRAM, limiting very large scenes or high-resolution projects ❌ Not suitable for 4K gaming or extremely demanding rendering tasks ❌ Limited future-proofing compared to higher-end GPUs |
| GTX 1050 Ti | ✅ Lower cost and budget-friendly for casual gamers ✅ Lower power consumption (~75W) and easier cooling ✅ Adequate for light 1080p gaming, basic 3D tasks, and simple video editing |
❌ Lower performance in gaming, 3D rendering, and GPU tasks compared to 1650 ❌ Only 4 GB VRAM, limiting medium to complex projects ❌ Slower rendering and less efficient for GPU-accelerated workflows |
GTX 1650 & GTX 1050 Ti Hosting
The GTX 1050 Ti and GTX 1650 cater to entry-level and mid-range performance needs, making them suitable for 1080p gaming, light 3D rendering, video editing, and moderate GPU workloads.
For individuals or small teams looking for GPU resources without investing in local hardware, GPU hosting provides a flexible and cost-effective solution. Database Mart offers GTX 1650 GPU servers, providing an affordable way to access capable GPUs. The GTX 1650 is ideal for entry-level to mid-range projects, delivering faster rendering, smoother gameplay, and efficient GPU-accelerated workflows.
Conclusion
GTX 1050 Ti: Budget-friendly, suitable for 1080p gaming, light 3D rendering, basic video editing, and small GPU-accelerated tasks.
GTX 1650: Entry-level to mid-range, offers higher performance, faster rendering, smoother gameplay, and better efficiency for 1080p gaming, moderate 3D projects, video editing, and GPU workloads.
In short: Both the GTX 1050 Ti and GTX 1650 are considered entry-level GPUs. The 1050 Ti is suitable for casual gaming and light creative work, while the 1650 offers a noticeable performance boost, making it better for entry-level to mid-range gaming and GPU-accelerated tasks. However, for AI workloads, both are limited and are generally only suitable for lightweight inference, typically for models under 3B parameters. Users should also consider memory constraints and performance bottlenecks when planning AI workloads on these cards.
1050 ti vs 1650, 1650 vs 1050 ti, 1650 vs 1050 ti benchmark, geforce 1650 vs 1050 ti, 1050 ti vs 1650 power consumption, GTX 1650 vs GTX 1050 Ti, 1650 vs 1050 ti price, 1650 vs 1050 ti specs, 1650 vs 1050 Ti benchmark