

RTX 3080 Ti vs RTX 4080 Performance Comparison: Gaming, AI, and Rendering Tested
This article compares the RTX 3080 Ti and RTX 4080 across real-world gaming, AI workloads, and 3D rendering. It covers detailed benchmarks, performance differences, and the technical reasons behind them, helping gamers, content creators, and AI developers choose the best GPU for their needs.
RTX 3080 Ti vs RTX 4080– Background Comparison
| Brand | Series | Model | Release Year | Official Positioning | Market Price (USD) |
|---|---|---|---|---|---|
| NVIDIA | GeForce | RTX 3080 Ti | 2021 | The NVIDIA GeForce RTX 3080 Ti delivers ultra-high-performance gaming and creative graphics, featuring real-time ray tracing and AI-powered acceleration. Built on the NVIDIA Ampere architecture with 12GB of high-speed GDDR6X memory, it provides immersive visuals and fast, efficient workflows. | ~$1199 |
| NVIDIA | GeForce | RTX 4080 | 2022 | The NVIDIA GeForce RTX 4080 delivers exceptional performance for gaming and creative workloads, featuring advanced ray tracing and AI-accelerated graphics. Powered by the ultra-efficient NVIDIA Ada Lovelace architecture and equipped with 16GB of high-speed GDDR6X memory, it brings realistic visuals and faster workflows to life. | ~$1199 |
RTX 3080 Ti vs RTX 4080– Specifications Comparison
Core Specs Comparison between RTX 3080 Ti vs RTX 4080
| Feature | RTX 4080 | RTX 3080 Ti | RTX 4080 Improvement / Gain |
|---|---|---|---|
| GPU Model | GeForce RTX 4080 | GeForce RTX 3080 Ti | Newer generation |
| Architecture | Ada Lovelace | Ampere | Improved efficiency & features |
| CUDA Cores | 9728 | 10240 | Higher IPC compensates for slightly fewer cores |
| Memory Type | GDDR6X | GDDR6X | Same |
| Memory Capacity | 16 GB | 12 GB | +33% VRAM |
| Memory Bandwidth | 720 GB/s | 912 GB/s | Faster effective performance due to architecture |
| Core Frequency (Base / Boost) | 2205 / 2505 MHz | 1365 / 1665 MHz | +50% higher boost frequency |
| TDP (Power Draw) | 320 W | 350 W | More power-efficient |
| Interface | PCIe 4.0 x16 | PCIe 4.0 x16 | Same |
| FP32 Performance | 49 TFLOPS | 34 TFLOPS | +44% FP32 performance |
| Tensor Cores | 304 | 320 | Improved generation, better AI/ML acceleration |
| PCIe Interface | 4.0 | 4.0 | Same |
The NVIDIA GeForce RTX 4080 builds upon the foundation of the RTX 3080 Ti with significant improvements in performance and efficiency. Powered by the Ada Lovelace architecture, it delivers higher clock speeds, increased VRAM (16GB vs 12GB), and more efficient power usage, resulting in up to 44% higher FP32 performance despite slightly fewer CUDA cores. Architectural enhancements also improve ray tracing, AI acceleration, and overall throughput, making the RTX 4080 a substantial upgrade for gaming, rendering, and AI workloads.
Advanced Feature Comparison between RTX 3080 Ti vs RTX 4080
| Feature | RTX 4080 | RTX 3080 Ti | RTX 4080 Improvement / Gain |
|---|---|---|---|
| Shader Execution Efficiency | Ada Lovelace third-gen SMs | Ampere second-gen SMs | Improved shader throughput, higher instructions per clock (IPC) |
| Ray Tracing Performance | 3rd-gen RT cores | 2nd-gen RT cores | Faster ray tracing, more rays per clock, better real-time rendering |
| AI/ML Acceleration | 4th-gen Tensor Cores | 3rd-gen Tensor Cores | Improved DLSS 3 & AI workloads, higher tensor throughput |
| L2 Cache & Memory Subsystem | 48 MB L2 cache | 6 MB L2 cache | Massive increase in cache reduces memory latency, improves throughput |
| Memory Speed / Bandwidth Efficiency | 16GB GDDR6X @ 720 GB/s | 12GB GDDR6X @ 912 GB/s | Despite slightly lower raw bandwidth, smarter memory hierarchy improves effective bandwidth |
| Concurrent Workloads | Multi-threaded GPU scheduling enhanced | Standard Ampere scheduler | Better simultaneous compute, ray tracing, and AI task handling |
| Rasterization Performance | Optimized pipelines & higher clock | Standard pipelines | Higher FPS in rasterized games and faster real-time rendering |
| Power Efficiency / Performance per Watt | 320 W | 350 W | Higher performance per watt thanks to Ada Lovelace optimizations |
The RTX 4080 outperforms the RTX 3080 Ti primarily due to its Ada Lovelace architecture, which improves shader efficiency, ray tracing, and AI acceleration. Its larger L2 cache and optimized memory hierarchy reduce latency and boost effective bandwidth, while enhanced multi-threaded scheduling enables better handling of concurrent workloads. These architectural improvements, combined with higher clock speeds and greater power efficiency, result in faster gaming, rendering, and AI performance per watt.
Share your GPU workload (training, inference, rendering, or gaming) ,
👉 and get a personalized GPU server recommendation with a free monthly pricing breakdown.
RTX 3080 Ti vs RTX 4080 Performance Across Different Scenarios
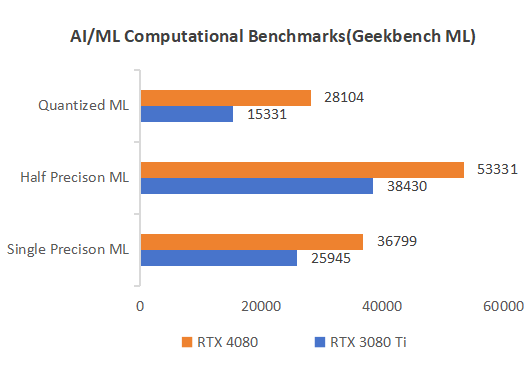
Artificial Intelligence Testing
The benchmark table highlights that the RTX 4080 significantly outperforms the RTX 3080 Ti across single precision, half precision, and quantized ML workloads, with gains ranging from roughly 39% to 83%. This improvement is primarily due to the 4080’s new Ada Lovelace architecture, enhanced Tensor cores, and more efficient memory/cache system, which collectively boost throughput for AI inference, image generation, and other GPU-intensive tasks. As a result, the RTX 4080 can handle larger models, higher batch sizes, and more complex AI workloads with noticeably better performance.
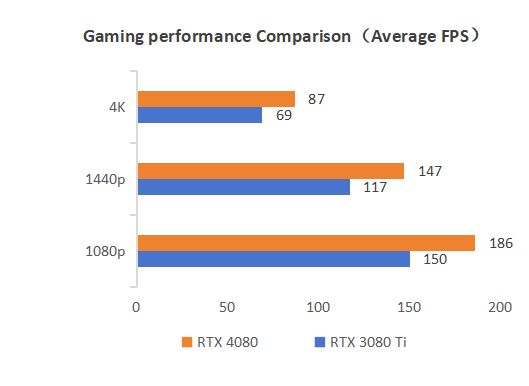
Gaming Performance
The RTX 4080 consistently outperforms the RTX 3080 Ti across all resolutions, delivering roughly 22–26% higher FPS. This performance gain is primarily due to the 4080’s more efficient Ada Lovelace architecture, higher clock speeds, and improved ray tracing and AI acceleration capabilities, which allow it to handle higher settings and resolutions more smoothly.
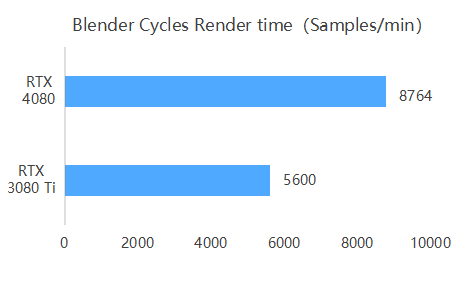
3D Rendering
The RTX 4080 completes Blender Cycles GPU renders about 56% faster than the RTX 3080 Ti, thanks to its more efficient Ada Lovelace architecture, higher CUDA core count, and faster memory, which together accelerate ray-tracing and handle complex scenes more effectively.
Price & Value: RTX 3080 Ti vs RTX 4080
Price Comparison
| Platform / Retailer | NVIDIA RTX 4080 (USD) | NVIDIA RTX 3080 Ti (USD) | Price Difference (USD) | Price Difference (%) |
|---|---|---|---|---|
| Official MSRP | ~$1199 | ~$1199 | ~$0 | ~0% |
| Retail / Resellers | ~$1400–$1800+ | ~$1000–$1200 | +$200–$600 | +20%–+50% |
| Secondary / Marketplace | ~$1200–$1700 | ~$900–$1100 | +$300–$600 | +27%–+55% |
The RTX 3080 Ti and RTX 4080 occupy the high-end GPU segment, with the RTX 4080 priced roughly $200–$600 higher depending on retail and marketplace (~20%–50%).
User Value-for-Money Feedback
User value‑for‑money feedback generally shows that the RTX 3080 Ti delivers strong performance per dollar for high-end gaming and creative workloads compared with the RTX 4080, since it costs less while handling most modern games and applications effectively. The RTX 4080, though more expensive, offers higher raw performance, improved ray tracing, AI acceleration, and better efficiency, making it worthwhile for users who prioritize maximum performance, advanced rendering, or AI/ML workloads.
High-end GPU performance, low-cost pricing! Get started today and take your workloads to the next level.
👉 Check out GPU server plans.
RTX 3080 Ti vs RTX 4080 – Pros & Cons
| Model | Pros | Cons |
|---|---|---|
| RTX 3080 Ti | ✅ Excellent performance for high-end gaming and creative workloads ✅ Lower cost compared with RTX 4080 ✅ Handles most modern games and applications effectively ✅ Strong 4K gaming performance |
❌ Less efficient ray tracing and AI acceleration compared with RTX 4080 ❌ Higher power consumption than newer architecture ❌ Limited future-proofing for next-gen workloads |
| RTX 4080 | ✅ Superior raw performance and memory bandwidth ✅ Improved ray tracing and AI/Tensor cores ✅ Better efficiency and performance per watt ✅ Ideal for demanding AI, rendering, and next-gen gaming |
❌ Higher cost than RTX 3080 Ti ❌ May be overkill for standard gaming or less demanding workloads ❌ Requires newer power and cooling considerations |
RTX 3080 Ti vs RTX 4080 Hosting
The RTX 3080 Ti and RTX 4080 deliver high-end performance for 4K gaming, 3D rendering, AI workloads, and GPU-intensive applications. While the RTX 3080 Ti offers strong performance at a lower cost, the RTX 4080 provides superior ray tracing, AI acceleration, and overall efficiency.
For individuals or teams needing GPU resources without investing in local hardware, GPU hosting provides a flexible and cost-effective solution. Database Mart
offers RTX 4090 GPU servers, which provide access to top-tier GPUs. While slightly above the RTX 4080 in raw performance, the RTX 4090 delivers exceptional performance for gaming, rendering, AI/ML workloads, and other GPU-intensive applications, making it the ideal choice for users who want maximum capabilities without purchasing local high-end hardware.
Not sure which GPU fits your needs?
👉 Get a tailored GPU personalized recommendations from DatabaseMart.
Conclusion
In the end, the RTX 30/40 series offers solid options across different budgets and workloads. The RTX 3080 Ti stands out as the best value for high-end 4K gaming and standard creative work, while the RTX 4080 excels for those who want smoother performance in ray-traced games, demanding rendering, or AI/ML workloads. For users aiming to tackle next-gen gaming, large-scale AI models, or intensive 3D rendering, the RTX 4080 is the clear choice. Your decision ultimately depends on whether you prioritize value, balanced performance, or maximum future-proofing.
RTX 3080 Ti vs RTX 4080, 3080 Ti vs 4080, NVIDIA RTX 3080 Ti vs RTX 4080, RTX 3080 Ti vs 4080 benchmarks, RTX 3080 Ti vs 4080 VRAM, RTX 3080 Ti vs 4080 specs, RTX 4080 vs RTX 3080 Ti performance