


A5000 vLLM Benchmark: 50 Concurrent Requests Test Hugging Face LLMs

A5000 vLLM Benchmark: Performance Testing for Hugging Face LLMs
Deploying large language models (LLMs) on high-performance GPUs like the NVIDIA A5000 requires a deep understanding of vLLM performance tuning. Recent benchmarks conducted on Hugging Face models using the vLLM backend provide valuable insights into how different models perform under varying loads. This benchmark evaluates A5000 test results, focusing on throughput, latency, concurrent request handling, and inference efficiency.
If you're looking for vLLM server rental, optimizing vLLM performance tuning, or understanding A5000 benchmark results, this report offers key takeaways.
Test Overview
1. A5000 GPU Details:
- GPU: Nvidia Quadro RTX A5000
- Microarchitecture: Ampere
- Compute capability: 8.6
- CUDA Cores: 8192
- Tensor Cores: 256
- Memory: 24GB GDDR6
- FP32 performance: 27.8 TFLOPS
2. Test Project Code Source:
- We used this git project to build the environment(https://github.com/vllm-project/vllm)
3. The Following Models from Hugging Face were Tested:
- Qwen/Qwen2.5-3B-Instruct
- Qwen/Qwen2.5-VL-7B-Instruct
- google/gemma-2-9b-it
- deepseek-ai/DeepSeek-R1-Distill-Qwen-1.5B
- deepseek-ai/DeepSeek-R1-Distill-Llama-8B
- deepseek-ai/DeepSeek-R1-Distill-Qwen-7B
4. The Test Parameters are Preset as Follows:
- Input length: 100 tokens
- Output length: 600 tokens
5. We conducted two rounds of A5000 vLLM tests under different concurrent request loads:
- Scenario 1: 50 concurrent requests
- Scenario 2: 300 concurrent requests
A5000 Benchmark for Scenario 1: 50 Concurrent Requests
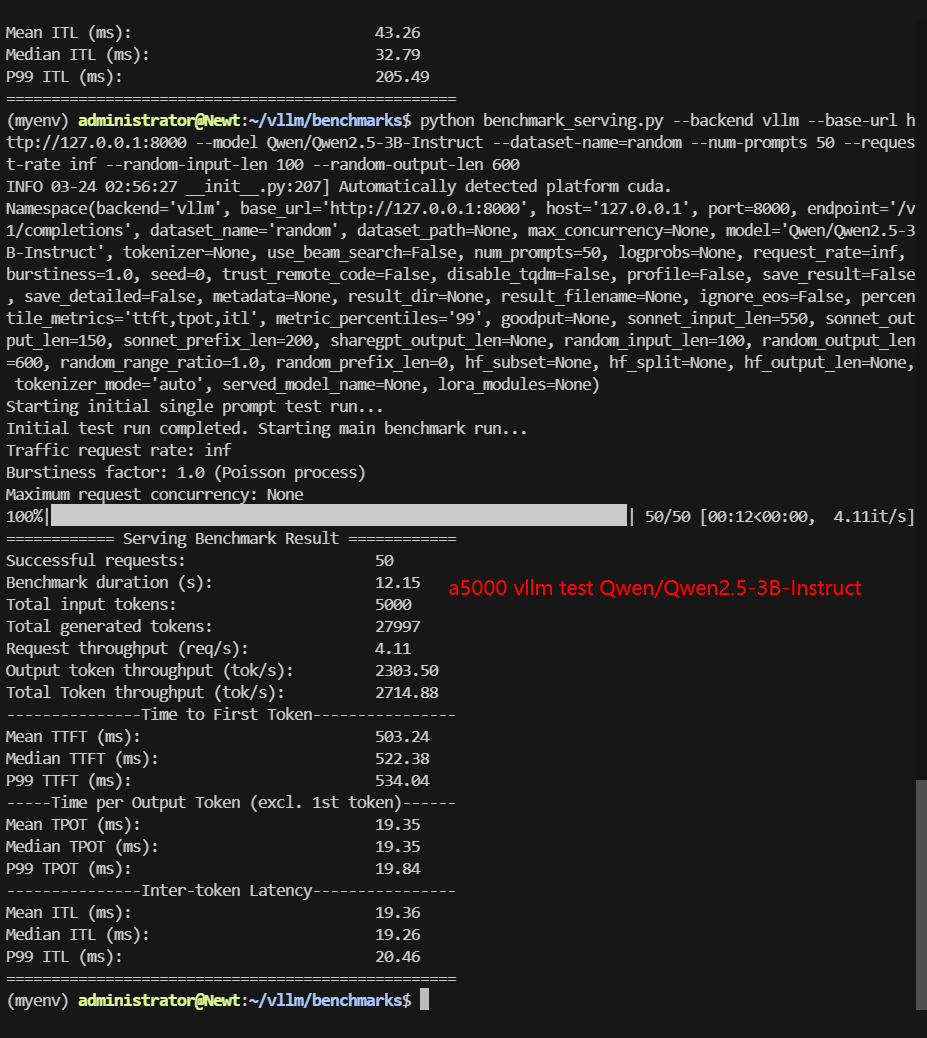
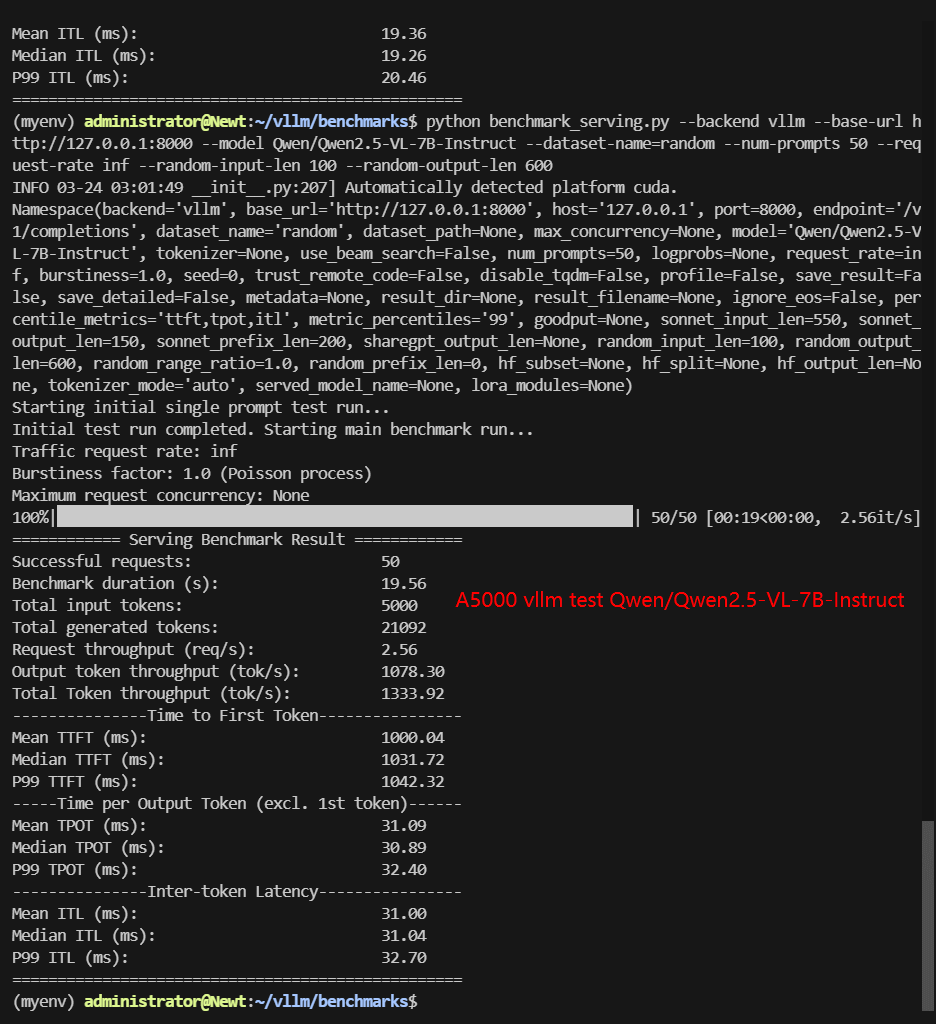
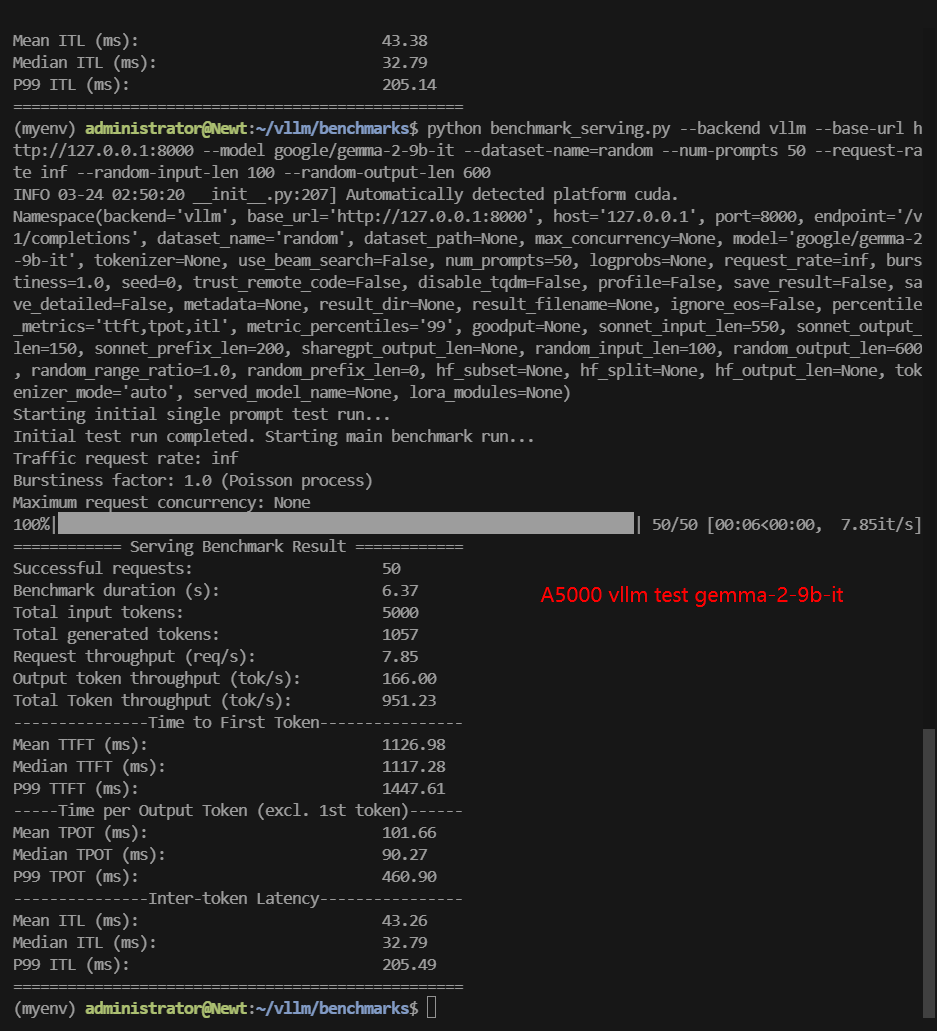
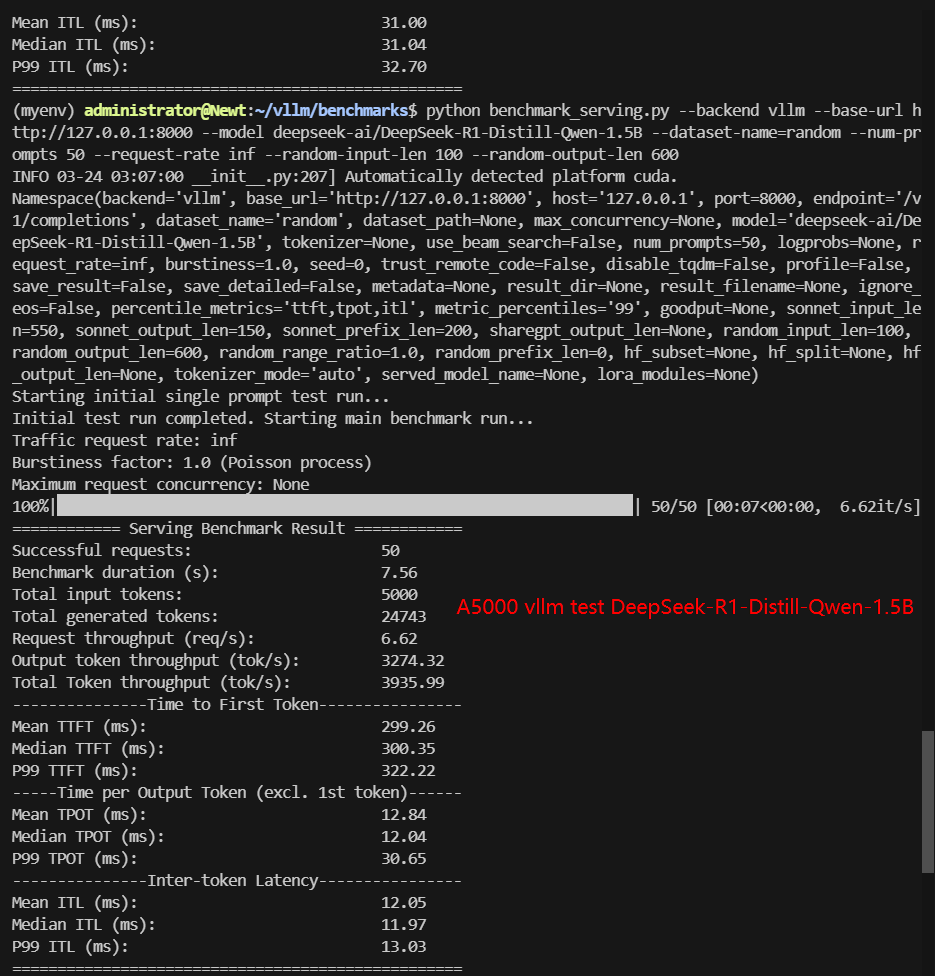
| Models | Qwen2.5-3B-Instruct | Qwen2.5-VL-7B-Instruct | gemma-2-9b-it | DeepSeek-R1-Distill-Qwen-1.5B | DeepSeek-R1-Distill-Llama-8B | DeepSeek-R1-Distill-Qwen-7B |
|---|---|---|---|---|---|---|
| Quantization | 16 | 16 | 16 | 16 | 16 | 16 |
| Size(GB) | 5.8 | 16 | 18 | 3.4 | 15 | 15 |
| Backend/Platform | vLLM | vLLM | vLLM | vLLM | vLLM | vLLM |
| Request Numbers | 50 | 50 | 50 | 50 | 50 | 50 |
| Benchmark Duration(s) | 12.15 | 19.56 | 6.37 | 7.56 | 21.86 | 19.55 |
| Total Input Tokens | 5000 | 5000 | 5000 | 5000 | 5000 | 5000 |
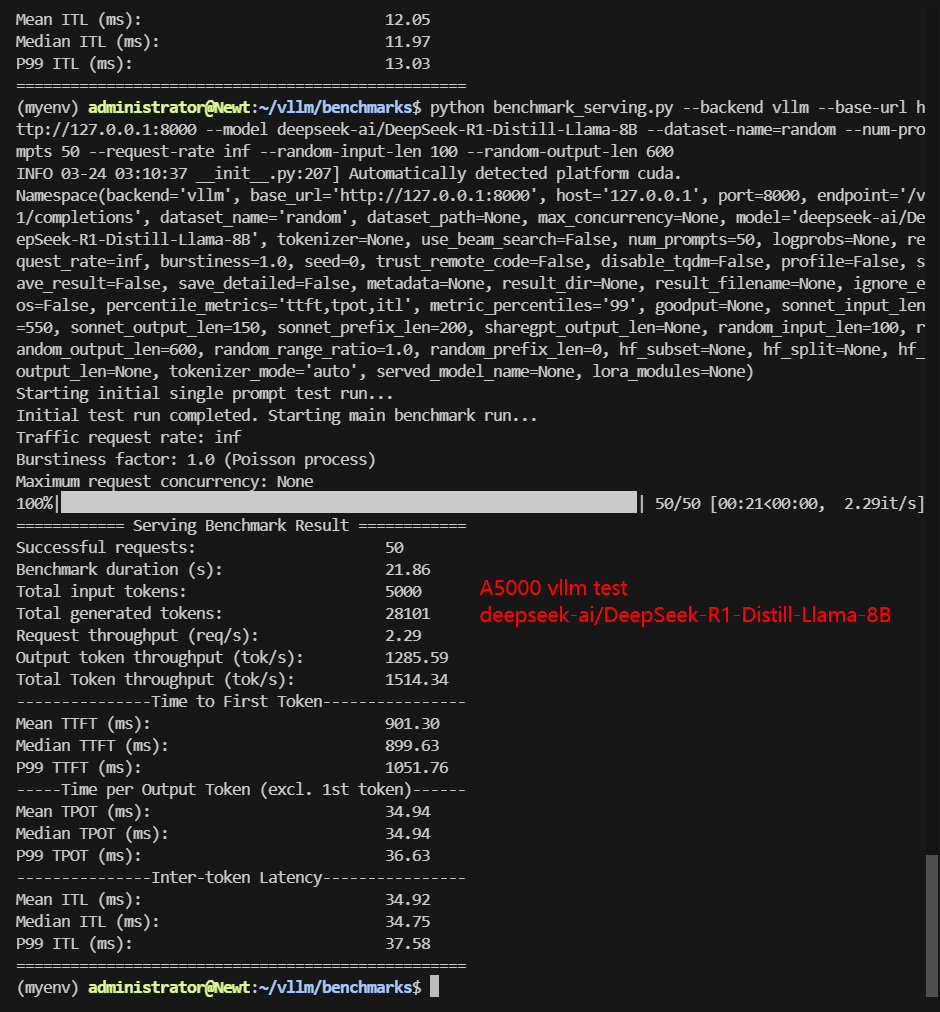
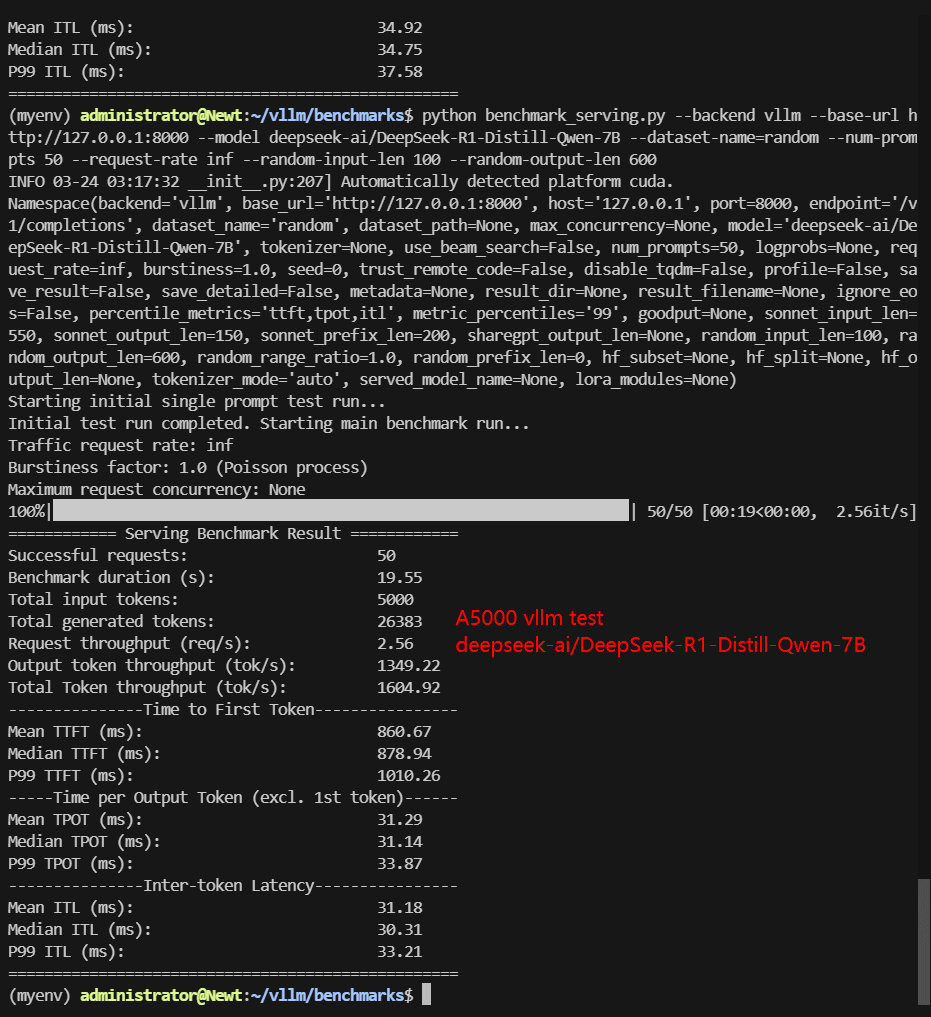
| Total Generated Tokens | 27997 | 21092 | 1057 | 24743 | 28101 | 26383 |
| Request (req/s) | 4.11 | 2.56 | 7.85 | 6.62 | 2.29 | 2.56 |
| Input (tokens/s) | 411.38 | 255.62 | 785.23 | 661.67 | 228.75 | 255.70 |
| Output (tokens/s) | 2303.50 | 1078.30 | 166.00 | 3274.32 | 1285.59 | 1349.22 |
| Total Throughput (tokens/s) | 2714.88 | 1333.92 | 951.23 | 3935.99 | 1514.34 | 1604.92 |
| Median TTFT(ms) | 522.38 | 1031.72 | 1117.28 | 300.35 | 899.63 | 878.94 |
| P99 TTFT(ms) | 534.04 | 1042.32 | 1447.61 | 322.22 | 1051.76 | 1010.26 |
| Median TPOT(ms) | 19.35 | 30.89 | 90.27 | 12.04 | 34.94 | 31.14 |
| P99 TPOT(ms) | 19.84 | 32.40 | 460.90 | 30.65 | 36.63 | 33.87 |
| Median Eval Rate(tokens/s) | 51.68 | 32.37 | 11.08 | 83.06 | 28.62 | 32.11 |
| P99 Eval Rate(tokens/s) | 50.40 | 30.86 | 2.17 | 32.63 | 27.30 | 29.52 |
✅ Key Takeaways:
- Smaller models (3B and below) processed requests much faster. DeepSeek-R1-Distill-Qwen-1.5B achieved a high throughput of 3935.99 tokens/s. Qwen2.5-3B-Instruct maintained good efficiency at 2714.88 tokens/s.
- Gemma 2-9B had lower output rates, indicating a preference for concise responses rather than performance bottlenecks.
- Larger models (7B and 8B) experienced increased latency, with TTFT exceeding 800ms.
- Per User Eval Rate was above 30 tokens/s for most models, ensuring smooth interaction.
A5000 Benchmark for Scenario 2: 300 Concurrent Requests
| Models | Qwen2.5-3B-Instruct | Qwen2.5-VL-7B-Instruct | gemma-2-9b-it | DeepSeek-R1-Distill-Qwen-1.5B | DeepSeek-R1-Distill-Llama-8B | DeepSeek-R1-Distill-Qwen-7B |
|---|---|---|---|---|---|---|
| Quantization | 16 | 16 | 16 | 16 | 16 | 16 |
| Size(GB) | 5.8 | 16 | 18 | 3.4 | 15 | 15 |
| Backend/Platform | vLLM | vLLM | vLLM | vLLM | vLLM | vLLM |
| Request Numbers | 300 | 300 | 300 | 300 | 300 | 300 |
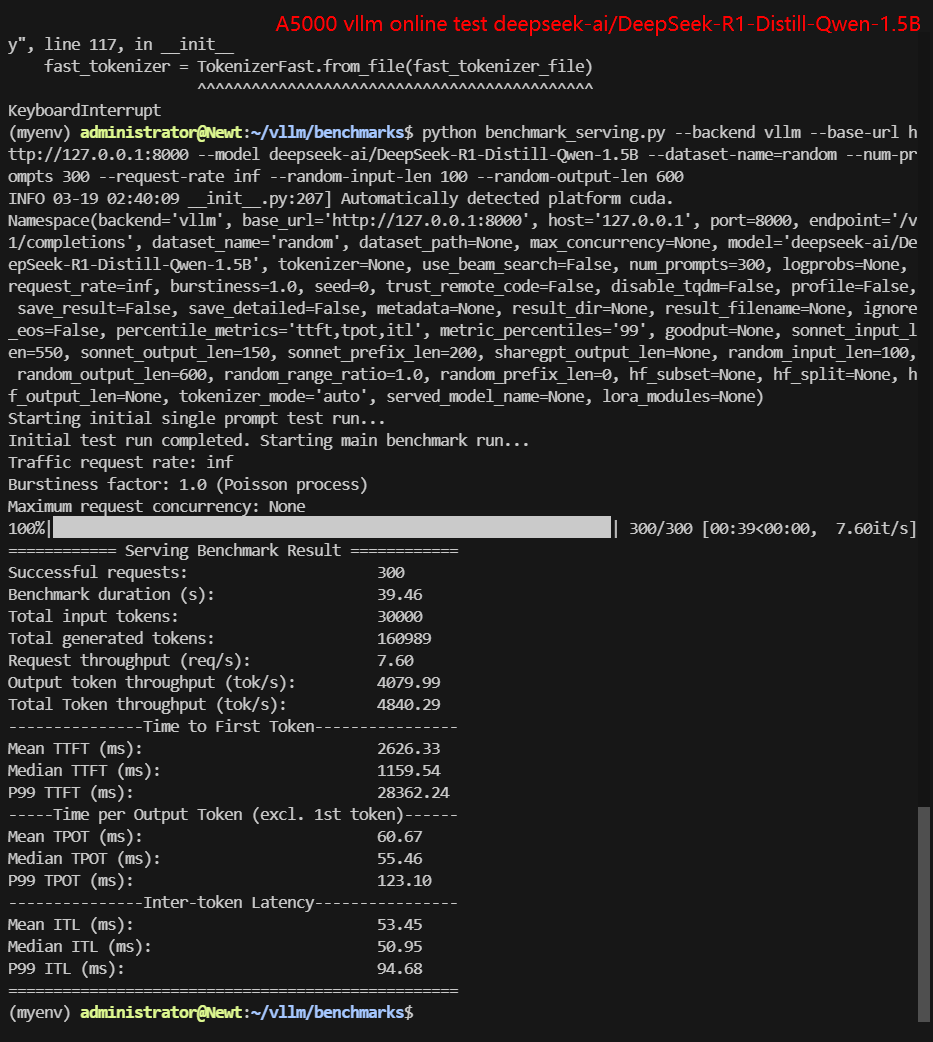
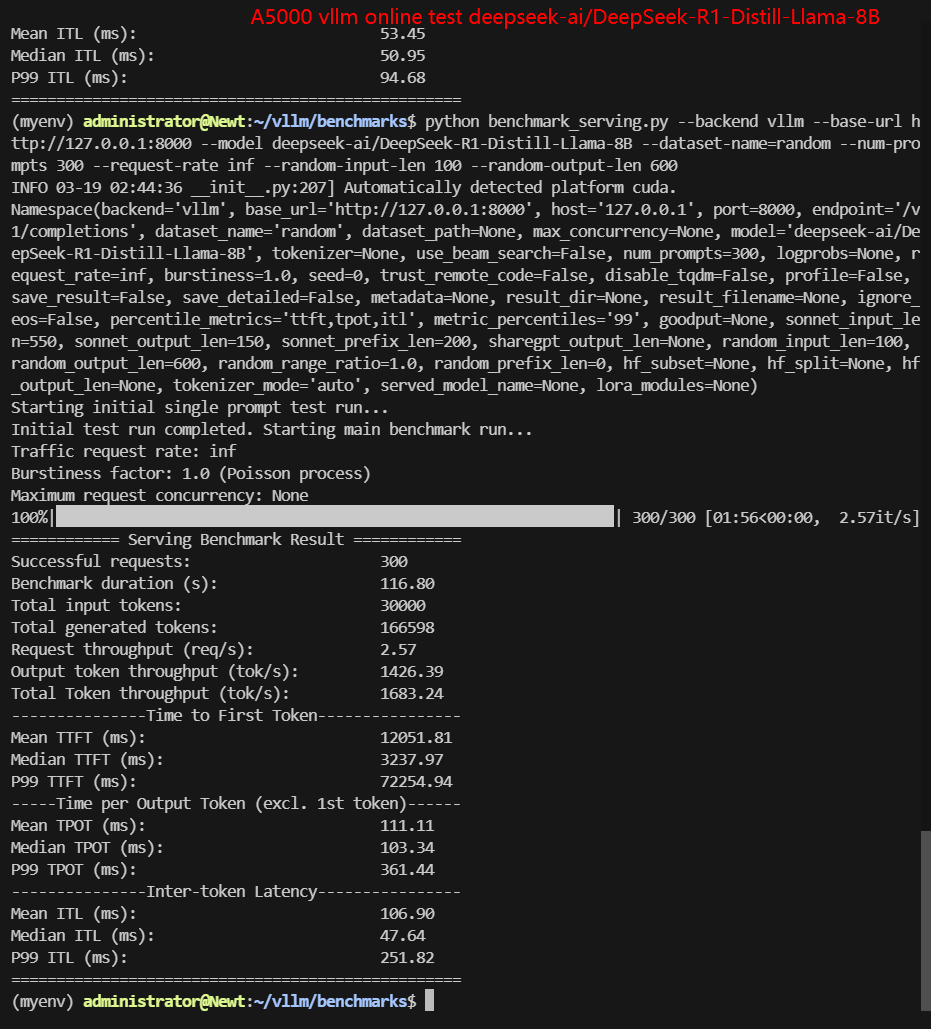
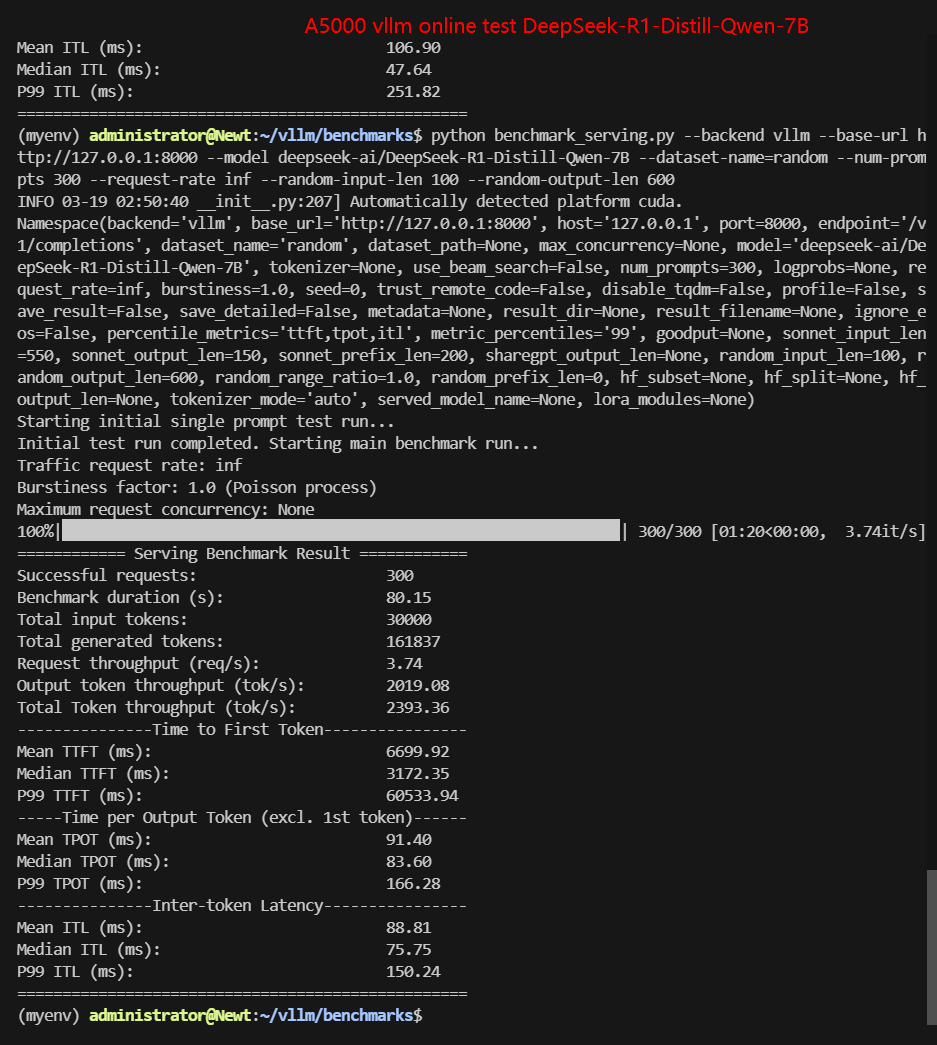
| Benchmark Duration(s) | 43.45 | 67.64 | 30.71 | 39.46 | 116.80 | 80.15 |
| Total Input Tokens | 30000 | 30000 | 30000 | 30000 | 30000 | 30000 |
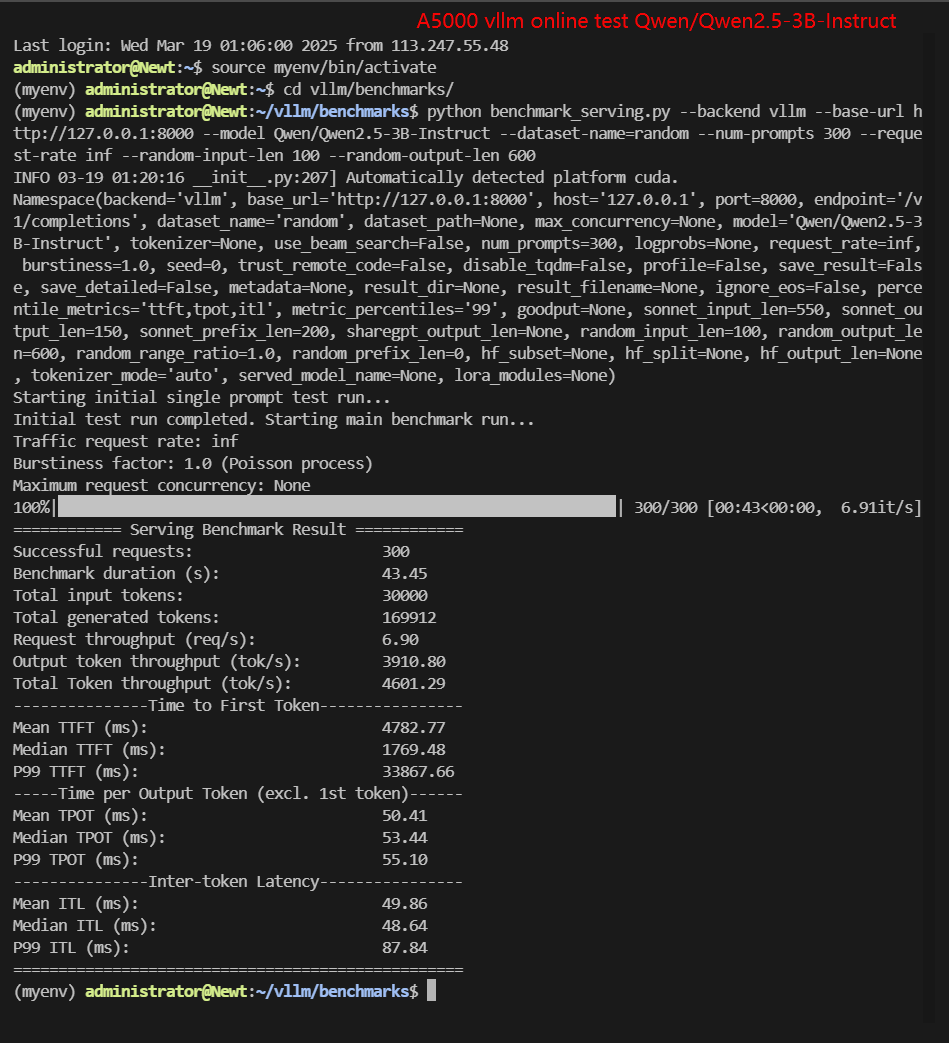
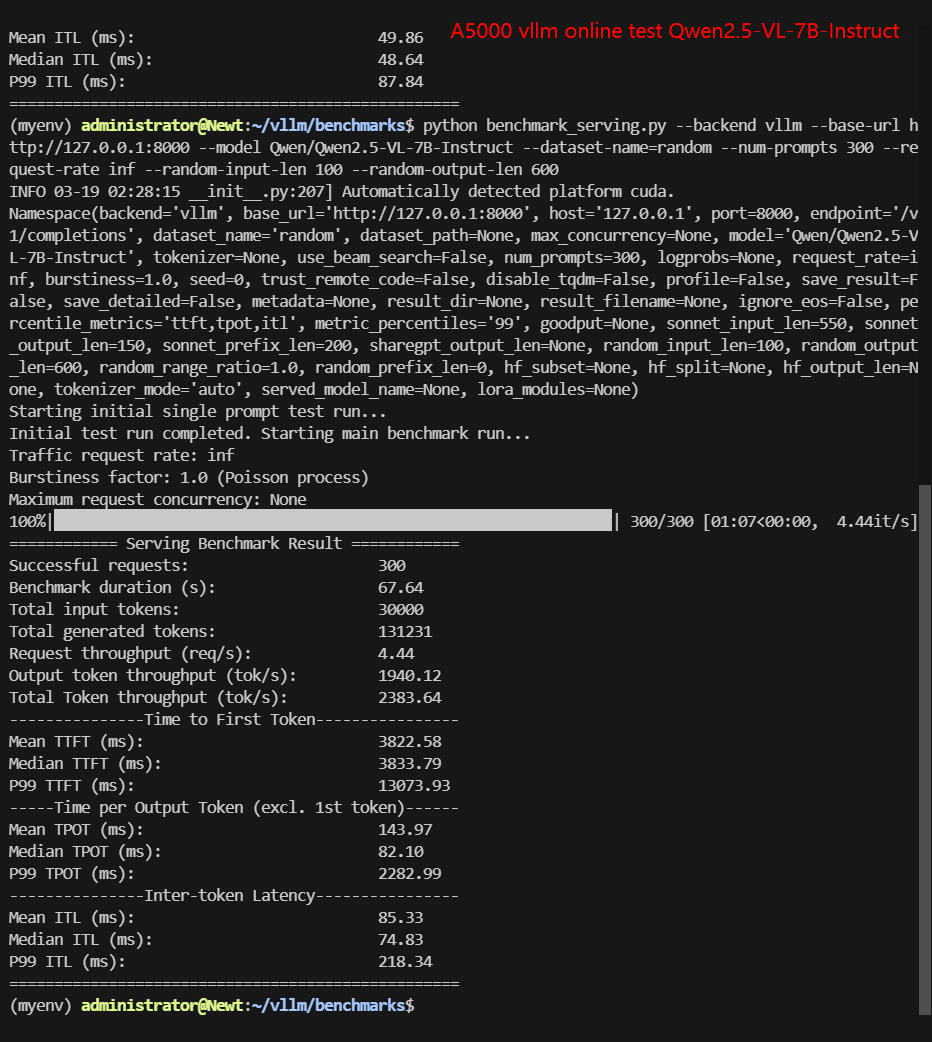
| Total Generated Tokens | 169912 | 131231 | 6106 | 160989 | 166598 | 161837 |
| Request (req/s) | 6.9 | 4.44 | 9.77 | 7.6 | 2.57 | 3.74 |
| Input (tokens/s) | 690.49 | 443.52 | 976.88 | 760.3 | 256.85 | 374.28 |
| Output (tokens/s) | 3910.80 | 1940.12 | 198.83 | 4079.99 | 1426.39 | 2019.08 |
| Total Throughput (tokens/s) | 4601.29 | 2383.64 | 1175.71 | 4840.29 | 1683.24 | 2393.36 |
| Median TTFT(ms) | 1769.48 | 3833.79 | 4464.43 | 1159.54 | 3237.97 | 3172.35 |
| P99 TTFT(ms) | 33867.66 | 13073.93 | 14602.77 | 28362.24 | 72254.94 | 60533.94 |
| Median TPOT(ms) | 53.44 | 82.10 | 96.79 | 55.46 | 103.34 | 83.60 |
| P99 TPOT(ms) | 55.10 | 2282.99 | 318.39 | 123.10 | 361.44 | 166.28 |
| Median Eval Rate(tokens/s) | 18.71 | 12.18 | 10.33 | 18.03 | 9.68 | 11.96 |
| P99 Eval Rate(tokens/s) | 18.14 | 0.44 | 3.14 | 8.12 | 2.77 | 6.01 |
✅ Key Takeaways:
- Server stress increased significantly at 300 concurrent requests. Median Eval Rate dropped to 10-12 tokens/s for most models. Qwen2.5-3B and DeepSeek-R1-Distill-Qwen-1.5B handled concurrent requests better than larger models.
- DeepSeek-R1-Distill-Qwen-7B and DeepSeek-R1-Distill-Llama-8B showed stable output but had high TTFT values exceeding 60s. This means that a5000 cannot handle 7-8b 300 concurrent requests. It is recommended to limit concurrent requests to 150.
- Gemma 2-9B's output remained relatively low, suggesting its architecture prioritizes compact responses.
Performance Analysis: Key Findings from the A5000 vLLM Benchmark
1. Impact of Request Volume on Performance:
The benchmark tests were conducted with two primary configurations:
- 50 requests: Input length of 100 tokens, output length of 600 tokens.
- 300 requests: Same input and output lengths but with a significantly higher request volume.
The results reveal that increasing the number of concurrent requests places substantial pressure on the server. For instance, the Per User Eval Rate dropped to around 10-18 tokens/s under 300 requests, indicating reduced efficiency. This suggests that while the A5000 can handle 50 requests effectively, scaling to 300 requests degrade performance, particularly for larger models.
2. Model-Specific Performance Insights
- Gemma-2-9b-it: This model exhibited lower output token rates, suggesting it prioritizes concise responses rather than facing performance bottlenecks. It is ideal for applications requiring brief, to-the-point answers.
- Qwen and DeepSeek Models: Smaller models like Qwen2.5-3B-Instruct and DeepSeek-R1-Distill-Qwen-1.5B demonstrated superior performance, especially in high-request scenarios. These models are recommended for environments requiring high concurrency and low latency.
- Larger Models (7B-8B): Models such as DeepSeek-R1-Distill-Llama-8B and DeepSeek-R1-Distill-Qwen-7B showed acceptable performance at 50 requests but struggled under 300 requests. For these models, it is advisable to limit concurrency to 150 requests to maintain user experience.
3. Hardware Considerations: A5000 Performance
The A5000 GPU demonstrated robust performance, particularly for models up to 9B in size. It is well-suited for inference tasks involving Hugging Face models, making it a viable option for vLLM production environments. However, for larger models or higher request volumes, more powerful GPUs like the RTX4090 or A100 may be necessary.
Insights for vLLM Performance Tuning
✅ Optimize Request Volume
Avoid overloading the server with excessive requests. For 7B-8B models, limit concurrency to 150 requests to maintain acceptable performance metrics.
✅ Choose the Right Model
For high-traffic environments, prioritize smaller models like Qwen2.5-3B-Instruct and DeepSeek-R1-Distill-Qwen-1.5B. These models offer a balanced trade-off between performance and resource utilization.
✅ Leverage vLLM Server Rental Services
For organizations looking to avoid the upfront costs of high-end GPUs, vLLM server rental services offer a flexible and cost-effective solution. These services provide access to optimized infrastructure, ensuring high performance without significant capital investment.
✅ Monitor and Adjust
Continuously monitor performance metrics such as TTFT, TPOT, and Eval Rate. Use these insights to fine-tune your deployment, adjusting request rates and model sizes as needed to maintain optimal performance.
✅ Consider Hardware Upgrades
If your workload demands higher performance, consider upgrading to more powerful GPUs like the A100 or H100. These GPUs offer enhanced capabilities, particularly for larger models and higher request volumes.
Get Started with RTX A5000 Server Rental!
Interested in optimizing your vLLM deployment? Check out our cheap GPU server hosting services or explore alternative GPUs for high-end AI inference.
Advanced GPU Dedicated Server - A5000
$ 269.00/mo
1mo3mo12mo24mo
Order Now- 128GB RAM
- Dual 12-Core E5-2697v2
- 240GB SSD + 2TB SSD
- 100Mbps-1Gbps
- OS: Windows / Linux
- GPU: Nvidia Quadro RTX A5000
- Microarchitecture: Ampere
- CUDA Cores: 8192
- Tensor Cores: 256
- GPU Memory: 24GB GDDR6
- FP32 Performance: 27.8 TFLOPS
Enterprise GPU Dedicated Server - RTX 4090
$ 409.00/mo
1mo3mo12mo24mo
Order Now- 256GB RAM
- Dual 18-Core E5-2697v4
- 240GB SSD + 2TB NVMe + 8TB SATA
- 100Mbps-1Gbps
- OS: Windows / Linux
- GPU: GeForce RTX 4090
- Microarchitecture: Ada Lovelace
- CUDA Cores: 16,384
- Tensor Cores: 512
- GPU Memory: 24 GB GDDR6X
- FP32 Performance: 82.6 TFLOPS
- Perfect for 3D rendering/modeling , CAD/ professional design, video editing, gaming, HPC, AI/deep learning.
Enterprise GPU Dedicated Server - A100
$ 639.00/mo
1mo3mo12mo24mo
Order Now- 256GB RAM
- Dual 18-Core E5-2697v4
- 240GB SSD + 2TB NVMe + 8TB SATA
- 100Mbps-1Gbps
- OS: Windows / Linux
- GPU: Nvidia A100
- Microarchitecture: Ampere
- CUDA Cores: 6912
- Tensor Cores: 432
- GPU Memory: 40GB HBM2
- FP32 Performance: 19.5 TFLOPS
- Good alternativeto A800, H100, H800, L40. Support FP64 precision computation, large-scale inference/AI training/ML.etc
New Arrival
Enterprise GPU Dedicated Server - A100(80GB)
$ 1559.00/mo
1mo3mo12mo24mo
Order Now- 256GB RAM
- Dual 18-Core E5-2697v4
- 240GB SSD + 2TB NVMe + 8TB SATA
- 100Mbps-1Gbps
- OS: Windows / Linux
- GPU: Nvidia A100
- Microarchitecture: Ampere
- CUDA Cores: 6912
- Tensor Cores: 432
- GPU Memory: 80GB HBM2e
- FP32 Performance: 19.5 TFLOPS
Conclusion: A5000 is the Best Choice for LLMs Below 8B
The NVIDIA A5000 proves to be a solid choice for LLM inference using vLLM on Hugging Face models. It efficiently runs 8B and smaller models while handling up to 150 concurrent requests smoothly.
For AI developers and cloud providers looking for cost-effective vLLM server rental, the A5000 is a great alternative to A100 for mid-sized LLM deployments.
The A5000 vLLM benchmark results highlight the importance of strategic model selection and performance tuning when deploying LLMs. By understanding the strengths and limitations of different models and hardware configurations, organizations can optimize their vLLM deployments for maximum efficiency and user satisfaction. Whether you're running benchmarks, considering a vLLM server rental, or planning a hardware upgrade, these insights will help you make informed decisions to meet your performance goals.
For more detailed benchmarks and performance tuning tips, stay tuned to our blog and explore our comprehensive guides on vLLM performance tuning, A5000 benchmark results, and Hugging Face LLM deployments.
Attachment: Video Recording of A5000 vLLM Benchmark
A5000 vLLM Benchmark: 300 Concurrent Requests Test Hugging Face LLMs
Screenshot: A5000 vLLM benchmark with 50 Concurrent Requests
Screenshot: A5000 vLLM benchmark with 300 Concurrent Requests

Data Item Explanation in the Table:
- Quantization: The number of quantization bits. This test uses 16 bits, a full-blooded model.
- Size(GB): Model size in GB.
- Backend: The inference backend used. In this test, vLLM is used.
- Successful Requests: The number of requests processed.
- Benchmark duration(s): The total time to complete all requests.
- Total input tokens: The total number of input tokens across all requests.
- Total generated tokens: The total number of output tokens generated across all requests.
- Request (req/s): The number of requests processed per second.
- Input (tokens/s): The number of input tokens processed per second.
- Output (tokens/s): The number of output tokens generated per second.
- Total Throughput (tokens/s): The total number of tokens processed per second (input + output).
- Median TTFT(ms): The time from when the request is made to when the first token is received, in milliseconds. A lower TTFT means that the user is able to get a response faster.
- P99 TTFT (ms): The 99th percentile Time to First Token, representing the worst-case latency for 99% of requests—lower is better to ensure consistent performance.
- Median TPOT(ms): The time required to generate each output token, in milliseconds. A lower TPOT indicates that the system is able to generate a complete response faster.
- P99 TPOT (ms): The 99th percentile Time Per Output Token, showing the worst-case delay in token generation—lower is better to minimize response variability.
- Median Eval Rate(tokens/s): The number of tokens evaluated per second per user. A high evaluation rate indicates that the system is able to serve each user efficiently.
- P99 Eval Rate(tokens/s): The number of tokens evaluated per second by the 99th percentile user represents the worst user experience.
Tags:
vLLM Performance Tuning, A5000 benchmark, A5000 benchmark results, A5000 test, vLLM A5000, Hugging Face LLM, vLLM server rental, LLM inference optimization, A5000 GPU benchmark, DeepSeek-R1 performance, AI model inference, vLLM token generation, AI latency test, cloud GPU rental, vLLM throughput