Test Overview
1. A6000 GPU Details:
- GPU: Nvidia Quadro RTX A6000
- Microarchitecture: Ampere
- Compute capability: 8.6
- CUDA Cores: 10,752
- Tensor Cores: 336
- Memory: 48GB GDDR6
- FP32 performance: 38.71 TFLOPS
2. Test Project Code Source:
- We used this git project to build the environment(https://github.com/vllm-project/vllm)
3. The Following Models from Hugging Face were Tested:
- Qwen/Qwen2.5-7B-Instruct
- Qwen/Qwen2.5-14B-Instruct
- meta-llama/Llama-3.1-8B-Instruct
- deepseek-ai/DeepSeek-R1-Distill-Llama-8B
- deepseek-ai/DeepSeek-R1-Distill-Qwen-14B
4. The Test Parameters are Preset as Follows:
- Input length: 100 tokens
- Output length: 600 tokens
5. We conducted two rounds of A6000 vLLM tests under different concurrent request loads:
- Scenario 1: 50 concurrent requests
- Scenario 2: 100 concurrent requests
A6000 Benchmark for Scenario 1: 50 Concurrent Requests
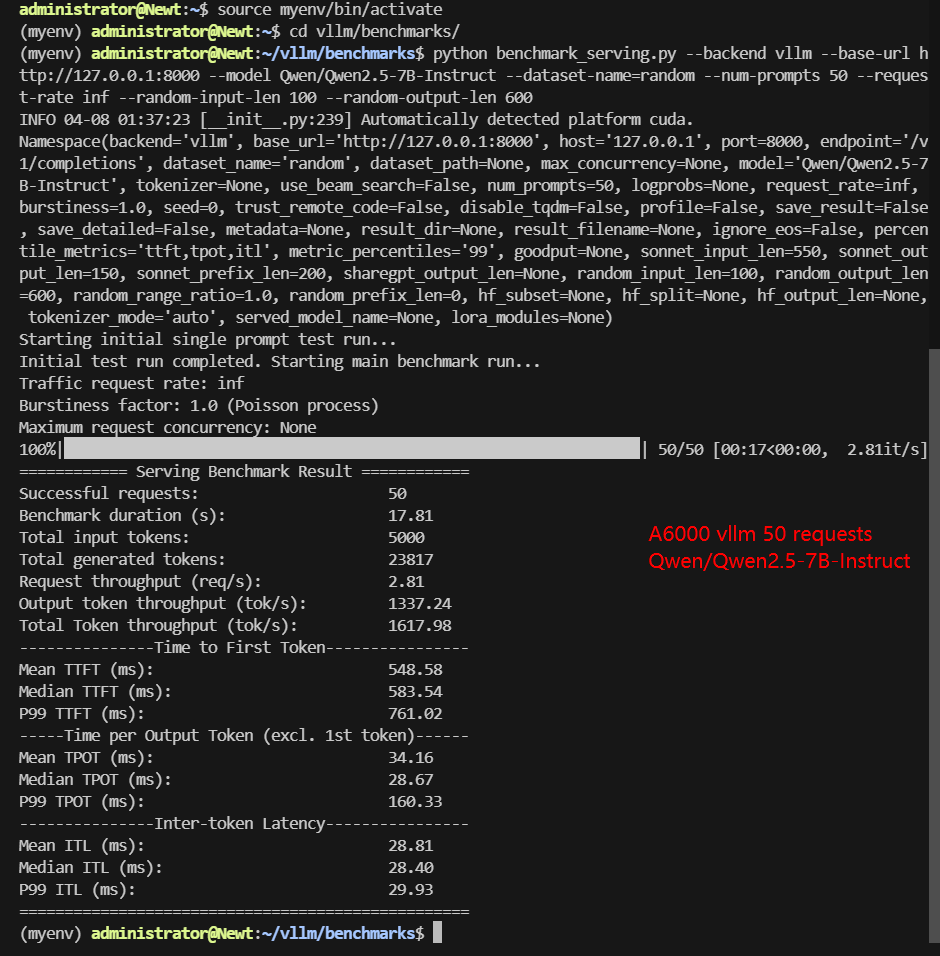
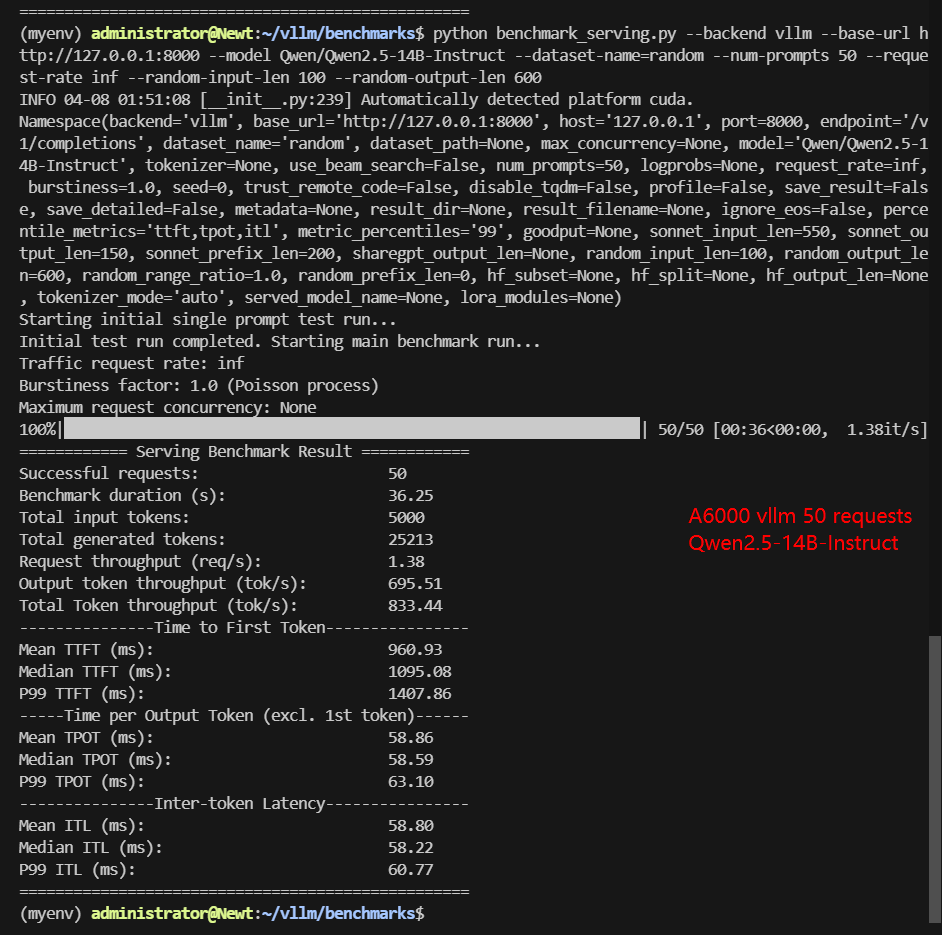
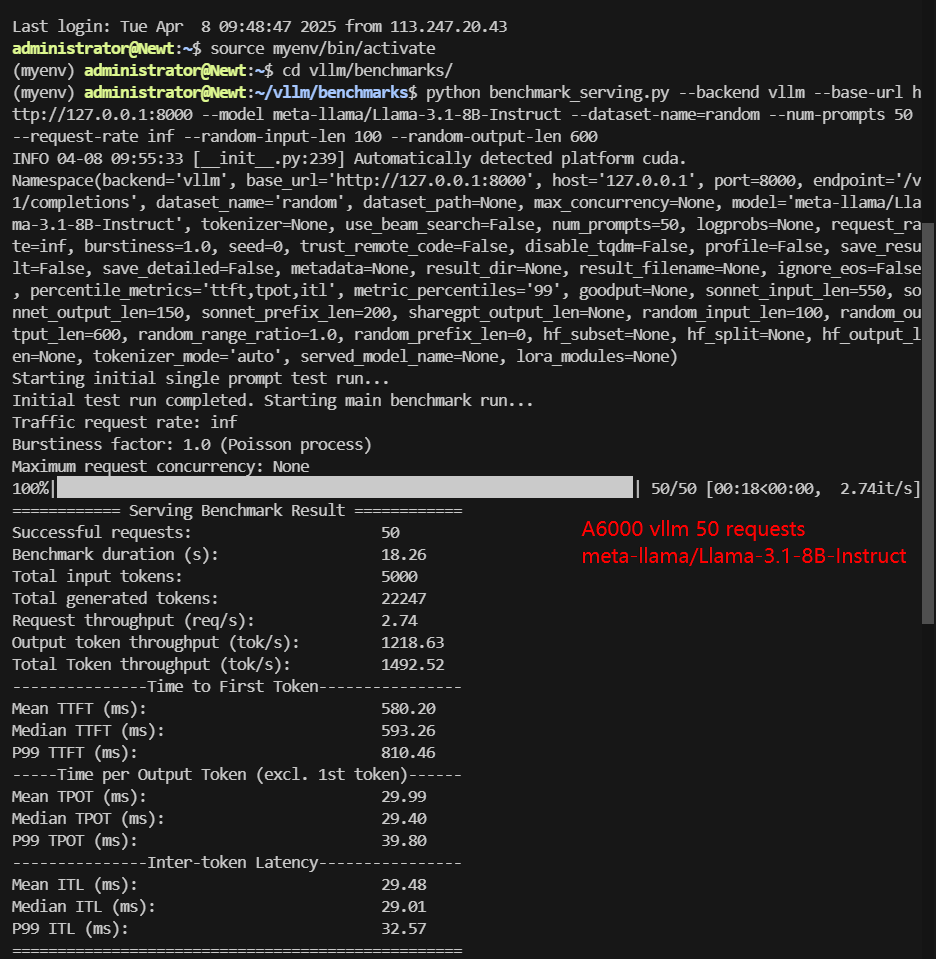
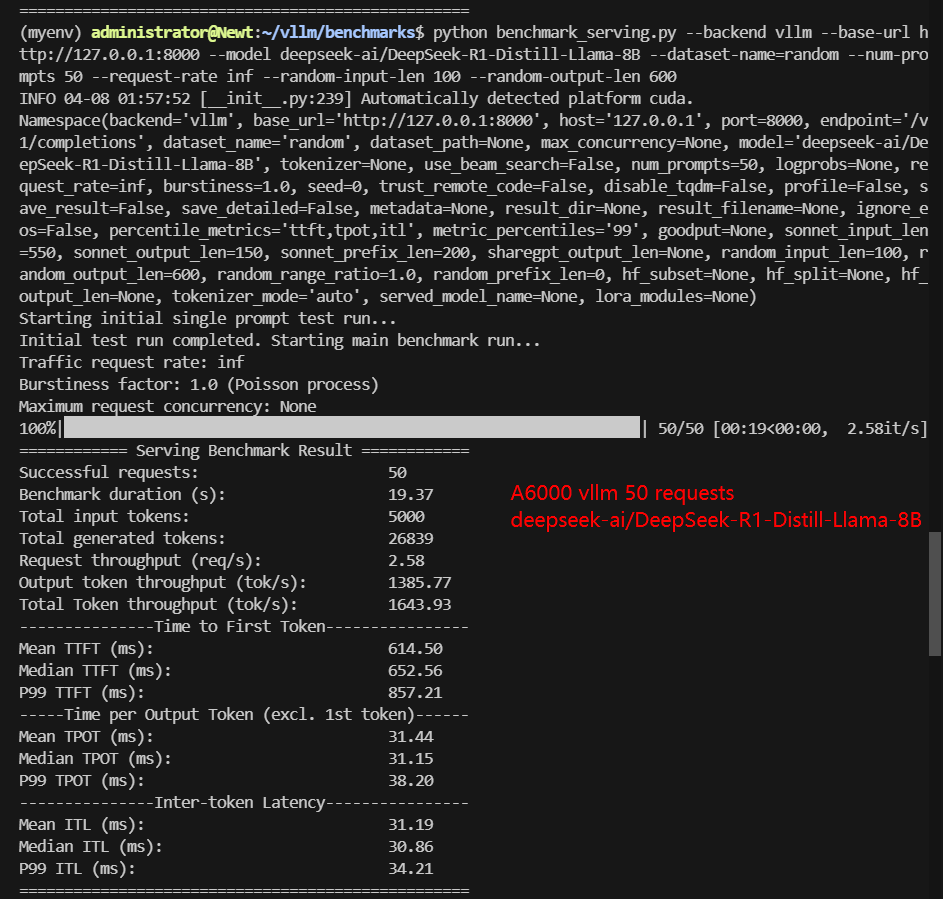
| Models | Qwen2.5-7B-Instruct | Qwen2.5-14B-Instruct | Llama-3.1-8B-Instruct | DeepSeek-R1-Distill-Llama-8B | DeepSeek-R1-Distill-Qwen-14B |
|---|---|---|---|---|---|
| Quantization | 16 | 16 | 16 | 16 | 16 |
| Size(GB) | 15 | 28 | 15 | 15 | 28 |
| Backend/Platform | vLLM | vLLM | vLLM | vLLM | vLLM |
| Request Numbers | 50 | 50 | 50 | 50 | 50 |
| Benchmark Duration(s) | 17.81 | 36.25 | 18.26 | 19.37 | 31.04 |
| Total Input Tokens | 5000 | 5000 | 5000 | 5000 | 5000 |
| Total Generated Tokens | 23817 | 25213 | 22247 | 26839 | 17572 |
| Request (req/s) | 2.81 | 1.38 | 2.74 | 2.58 | 1.61 |
| Input (tokens/s) | 280.74 | 137.93 | 273.89 | 258.16 | 161.07 |
| Output (tokens/s) | 1337.24 | 695.51 | 1218.63 | 1385.77 | 566.08 |
| Total Throughput (tokens/s) | 1617.98 | 833.44 | 1492.52 | 1643.93 | 727.15 |
| Median TTFT(ms) | 583.54 | 1095.08 | 593.26 | 652.56 | 474.60 |
| P99 TTFT(ms) | 761.02 | 1407.86 | 810.46 | 857.21 | 637.96 |
| Median TPOT(ms) | 28.67 | 58.59 | 29.40 | 31.15 | 51.18 |
| P99 TPOT(ms) | 160.33 | 63.10 | 39.80 | 38.20 | 64.46 |
| Median Eval Rate(tokens/s) | 34.88 | 17.07 | 34.01 | 32.10 | 19.54 |
| P99 Eval Rate(tokens/s) | 6.23 | 15.85 | 25.13 | 26.18 | 15.51 |
✅ Key Takeaways:
- The DeepSeek-R1-Distill-LLama-8B model achieved the highest total throughput at 1,643.93 tokens/s.
- Qwen2.5-7B-Instruct followed closely with 1,617.98 tokens/s.
- The larger Qwen2.5-14B-Instruct model showed expectedly lower throughput at 833.44 tokens/s, but this is not a slow speed.
A6000 Benchmark for Scenario 2: 100 Concurrent Requests
| Models | Qwen2.5-7B-Instruct | Qwen2.5-14B-Instruct | Llama-3.1-8B-Instruct | DeepSeek-R1-Distill-Llama-8B | DeepSeek-R1-Distill-Qwen-14B |
|---|---|---|---|---|---|
| Quantization | 16 | 16 | 16 | 16 | 16 |
| Size(GB) | 15 | 28 | 15 | 15 | 28 |
| Backend/Platform | vLLM | vLLM | vLLM | vLLM | vLLM |
| Request Numbers | 50 | 50 | 50 | 50 | 50 |
| Benchmark Duration(s) | 22.41 | 49.77 | 21.52 | 22.51 | 37.09 |
| Total Input Tokens | 10000 | 10000 | 10000 | 10000 | 10000 |
| Total Generated Tokens | 49662 | 51632 | 47223 | 54501 | 38003 |
| Request (req/s) | 4.46 | 2.01 | 4.65 | 4.44 | 2.70 |
| Input (tokens/s) | 446.22 | 200.93 | 464.6 | 444.22 | 269.61 |
| Output (tokens/s) | 2216.02 | 1037.44 | 2193.97 | 2421.04 | 1024.60 |
| Total Throughput (tokens/s) | 2662.24 | 1238.37 | 2658.57 | 2865.26 | 1294.21 |
| Median TTFT(ms) | 414.18 | 804.91 | 543.01 | 585.56 | 1673.75 |
| P99 TTFT(ms) | 950.56 | 1688.46 | 1015.96 | 1086.52 | 2830.12 |
| Median TPOT(ms) | 36.74 | 69.58 | 34.86 | 36.42 | 59.22 |
| P99 TPOT(ms) | 232.43 | 80.00 | 55.98 | 47.82 | 126.96 |
| Median Eval Rate(tokens/s) | 27.22 | 14.37 | 29.68 | 27.46 | 16.89 |
| P99 Eval Rate(tokens/s) | 4.30 | 12.5 | 17.86 | 20.91 | 7.87 |
✅ Key Takeaways:
- DeepSeek-R1-Distill-LLama-8B maintained its lead with 2,865.26 tokens/s.
- LLama-3.1-8B-Instruct showed strong scaling at 2,658.57 tokens/s.
- Qwen2.5-14B-Instruct remained the slowest at 1,238.37 tokens/s. Compared with 833.44 tokens/second for 50 concurrent requests, it has improved a lot, indicating that it has not reached the bottleneck when 50 concurrent requests are received. A6000 can support 100 concurrent requests for the 14b model.
Insights for A6000 vLLM Performance
✅ Model Size Considerations
✅ Supports 14B Models with High Concurrency
✅ Best Performer: DeepSeek R1-8B
✅ LLaMA 3-8B is a Sweet Spot
Get Started with RTX A6000 Server Rental!
Interested in optimizing your vLLM deployment? Check out our cheap GPU server hosting services or explore alternative GPUs for high-end AI inference.
Enterprise GPU Dedicated Server - RTX A6000
- 256GB RAM
- Dual 18-Core E5-2697v4
- 240GB SSD + 2TB NVMe + 8TB SATA
- 100Mbps-1Gbps
- OS: Windows / Linux
- GPU: Nvidia Quadro RTX A6000
- Microarchitecture: Ampere
- CUDA Cores: 10,752
- Tensor Cores: 336
- GPU Memory: 48GB GDDR6
- FP32 Performance: 38.71 TFLOPS
- Optimally running AI, deep learning, data visualization, HPC, etc.
Enterprise GPU Dedicated Server - RTX 4090
- 256GB RAM
- Dual 18-Core E5-2697v4
- 240GB SSD + 2TB NVMe + 8TB SATA
- 100Mbps-1Gbps
- OS: Windows / Linux
- GPU: GeForce RTX 4090
- Microarchitecture: Ada Lovelace
- CUDA Cores: 16,384
- Tensor Cores: 512
- GPU Memory: 24 GB GDDR6X
- FP32 Performance: 82.6 TFLOPS
- Perfect for 3D rendering/modeling , CAD/ professional design, video editing, gaming, HPC, AI/deep learning.
Enterprise GPU Dedicated Server - A100
- 256GB RAM
- Dual 18-Core E5-2697v4
- 240GB SSD + 2TB NVMe + 8TB SATA
- 100Mbps-1Gbps
- OS: Windows / Linux
- GPU: Nvidia A100
- Microarchitecture: Ampere
- CUDA Cores: 6912
- Tensor Cores: 432
- GPU Memory: 40GB HBM2
- FP32 Performance: 19.5 TFLOPS
- Good alternativeto A800, H100, H800, L40. Support FP64 precision computation, large-scale inference/AI training/ML.etc
Enterprise GPU Dedicated Server - A100(80GB)
- 256GB RAM
- Dual 18-Core E5-2697v4
- 240GB SSD + 2TB NVMe + 8TB SATA
- 100Mbps-1Gbps
- OS: Windows / Linux
- GPU: Nvidia A100
- Microarchitecture: Ampere
- CUDA Cores: 6912
- Tensor Cores: 432
- GPU Memory: 80GB HBM2e
- FP32 Performance: 19.5 TFLOPS
⚠️Notes: Gemma 3-12B is not compatible with A6000
Conclusion: A6000 is the Cheapest Choice for 7B-14B LLMs
The benchmark results demonstrate that A6000 GPUs with vLLM backend can effectively host medium-sized LLMs (7B-14B parameters) for production workloads. The DeepSeek-R1-Distill-LLama-8B model showed particularly strong performance across all metrics, making it an excellent choice for A6000 deployments requiring balanced throughput and latency.
For applications prioritizing throughput over model size, the 7B/8B class models generally provide better performance characteristics on A6000 hardware. The 14B models remain viable for applications where model capability outweighs pure performance metrics.
Attachment: Video Recording of A6000 vLLM Benchmark
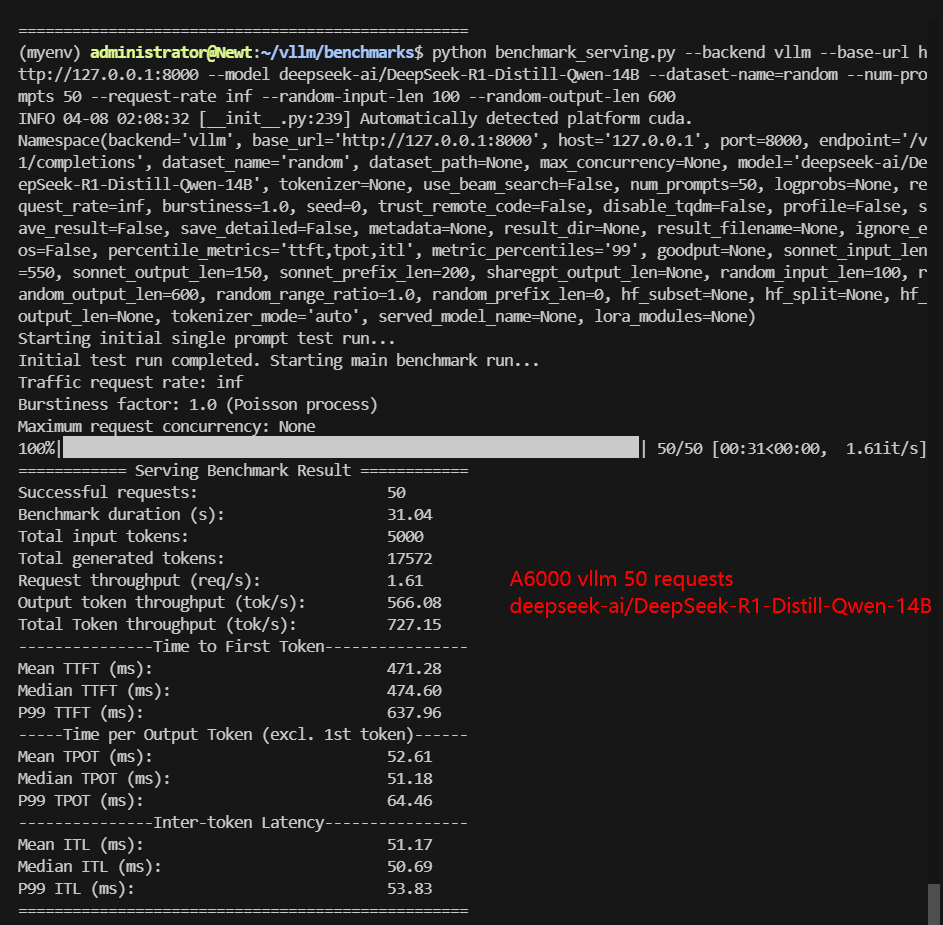


Data Item Explanation in the Table:
- Quantization: The number of quantization bits. This test uses 16 bits, a full-blooded model.
- Size(GB): Model size in GB.
- Backend: The inference backend used. In this test, vLLM is used.
- Successful Requests: The number of requests processed.
- Benchmark duration(s): The total time to complete all requests.
- Total input tokens: The total number of input tokens across all requests.
- Total generated tokens: The total number of output tokens generated across all requests.
- Request (req/s): The number of requests processed per second.
- Input (tokens/s): The number of input tokens processed per second.
- Output (tokens/s): The number of output tokens generated per second.
- Total Throughput (tokens/s): The total number of tokens processed per second (input + output).
- Median TTFT(ms): The time from when the request is made to when the first token is received, in milliseconds. A lower TTFT means that the user is able to get a response faster.
- P99 TTFT (ms): The 99th percentile Time to First Token, representing the worst-case latency for 99% of requests—lower is better to ensure consistent performance.
- Median TPOT(ms): The time required to generate each output token, in milliseconds. A lower TPOT indicates that the system is able to generate a complete response faster.
- P99 TPOT (ms): The 99th percentile Time Per Output Token, showing the worst-case delay in token generation—lower is better to minimize response variability.
- Median Eval Rate(tokens/s): The number of tokens evaluated per second per user. A high evaluation rate indicates that the system is able to serve each user efficiently.
- P99 Eval Rate(tokens/s): The number of tokens evaluated per second by the 99th percentile user represents the worst user experience.
A6000 vLLM benchmark, vLLM A6000 performance, A6000 LLMs multi-concurrency, A6000 hosting LLMs, Qwen vs LLaMA-3 A6000, DeepSeek-R1 A6000 benchmark, Best LLM for A6000, A6000 token throughput, LLM inference speed A6000, vLLM vs Ollama A6000


