


A6000 vLLM Benchmark Report: Multi-Concurrent LLM Inference Performance
In the rapidly evolving field of large language models (LLMs), performance benchmarking has become crucial for researchers and developers. This report analyzes the comparative performance of five popular Hugging Face LLMs running on NVIDIA A6000 GPUs using the vLLM backend, tested under both 50 and 100 concurrent request scenarios.
If you're looking for vLLM server rental, optimizing vLLM performance tuning, or understanding A6000 benchmark results, this report offers key takeaways.
Test Overview
1. A6000 GPU Details:
- GPU: Nvidia Quadro RTX A6000
- Microarchitecture: Ampere
- Compute capability: 8.6
- CUDA Cores: 10,752
- Tensor Cores: 336
- Memory: 48GB GDDR6
- FP32 performance: 38.71 TFLOPS
2. Test Project Code Source:
- We used this git project to build the environment(https://github.com/vllm-project/vllm)
3. The Following Models from Hugging Face were Tested:
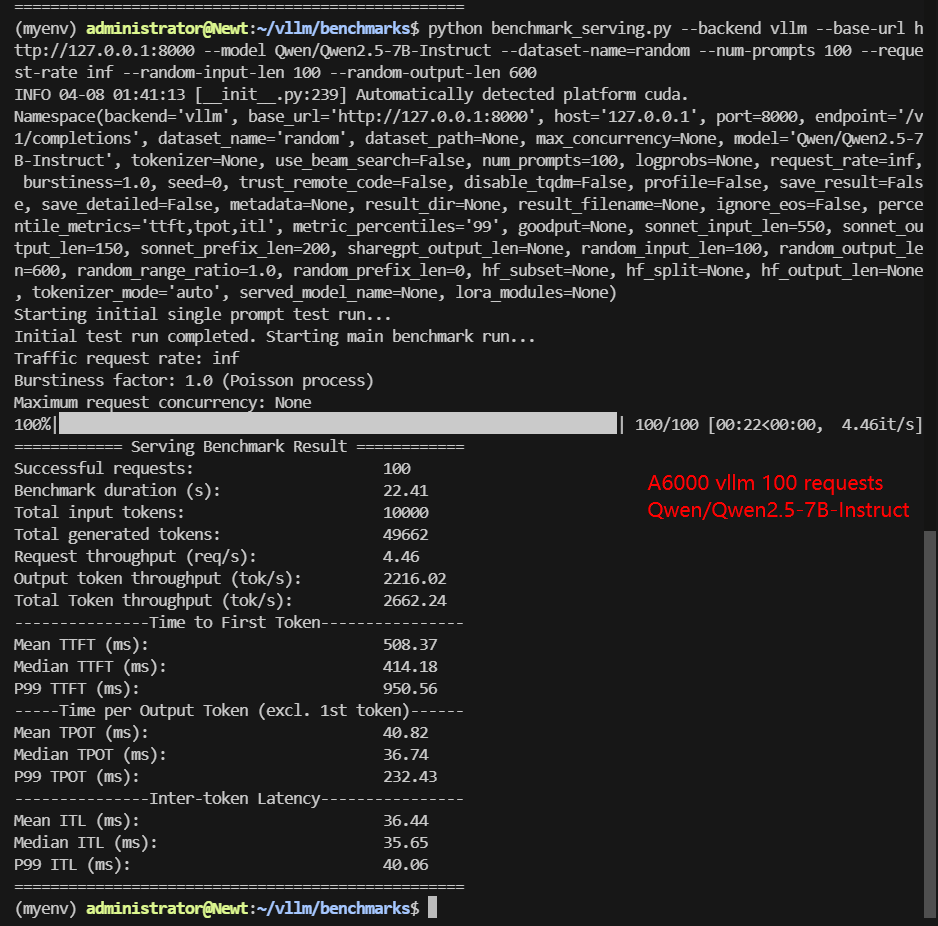
- Qwen/Qwen2.5-7B-Instruct
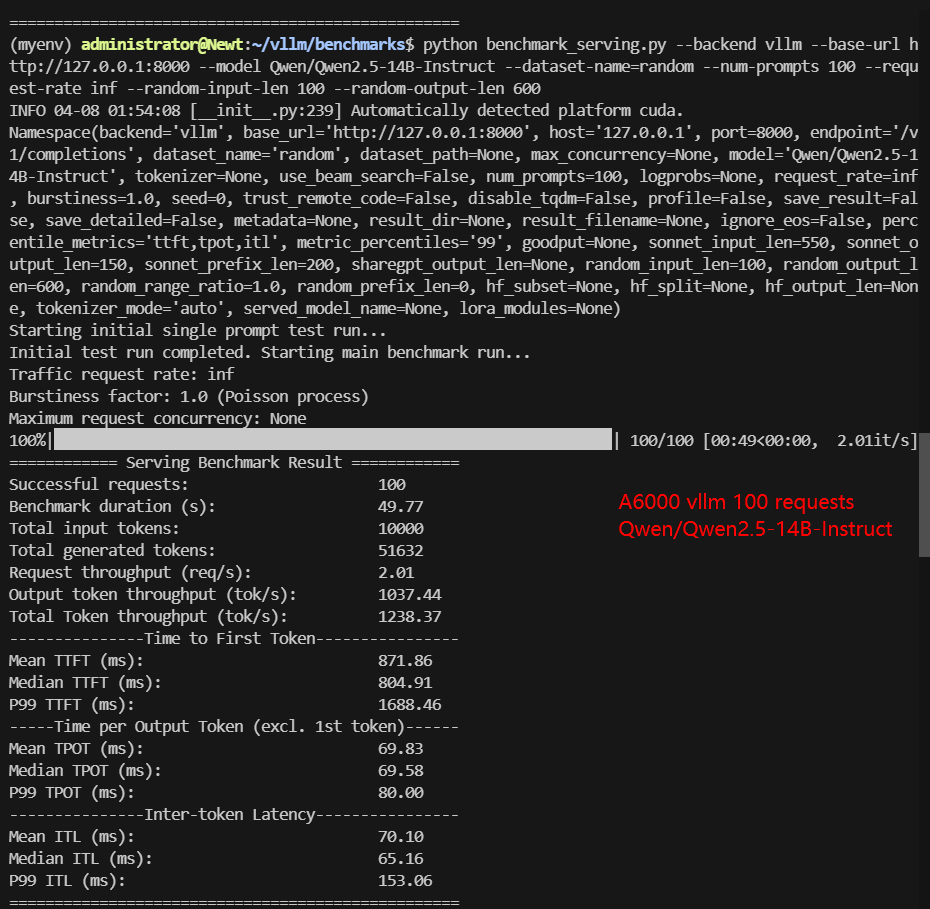
- Qwen/Qwen2.5-14B-Instruct
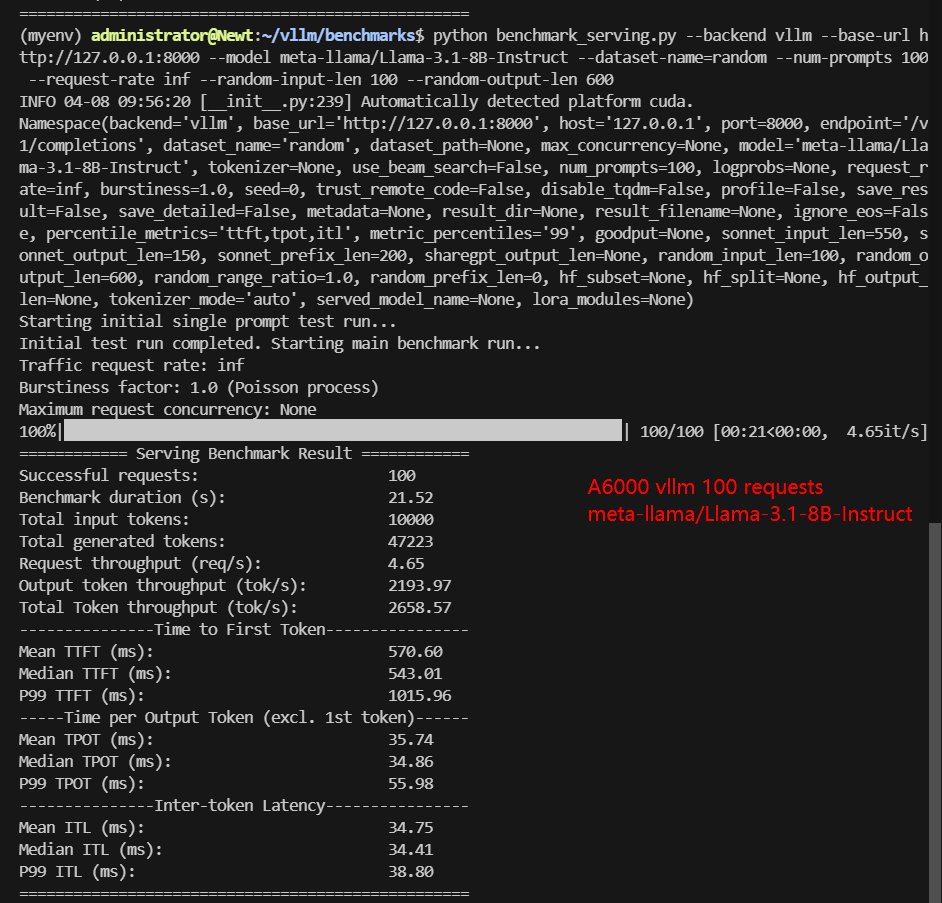
- meta-llama/Llama-3.1-8B-Instruct
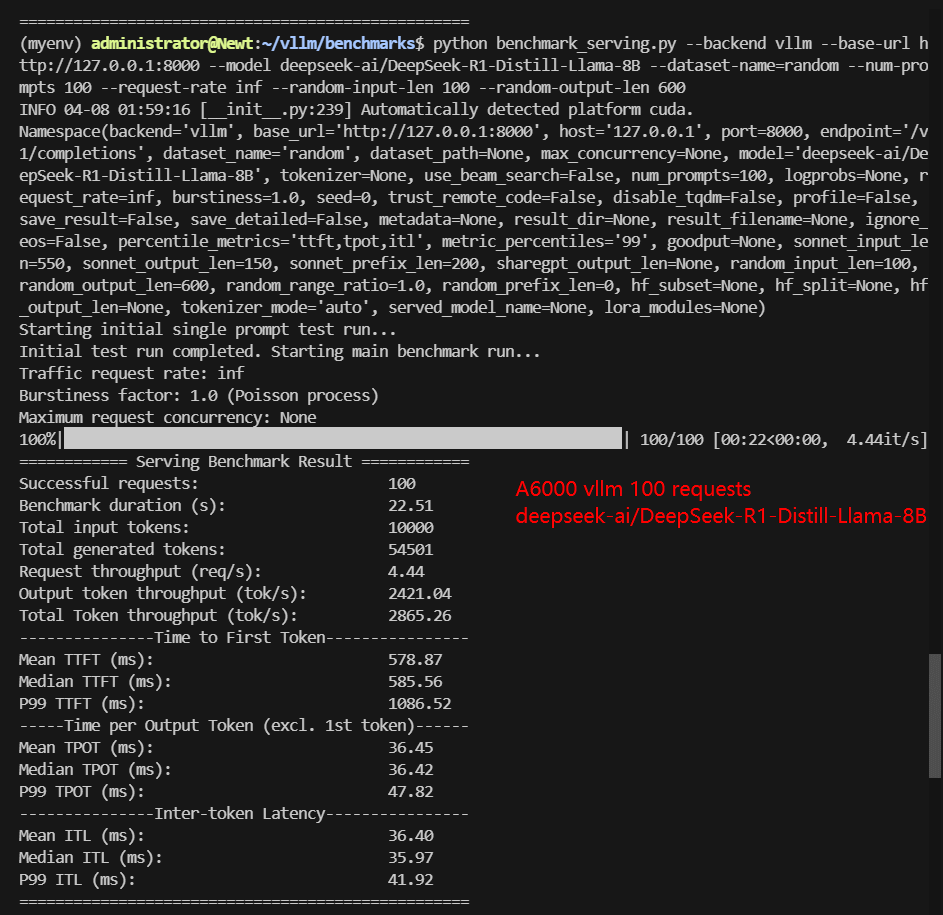
- deepseek-ai/DeepSeek-R1-Distill-Llama-8B
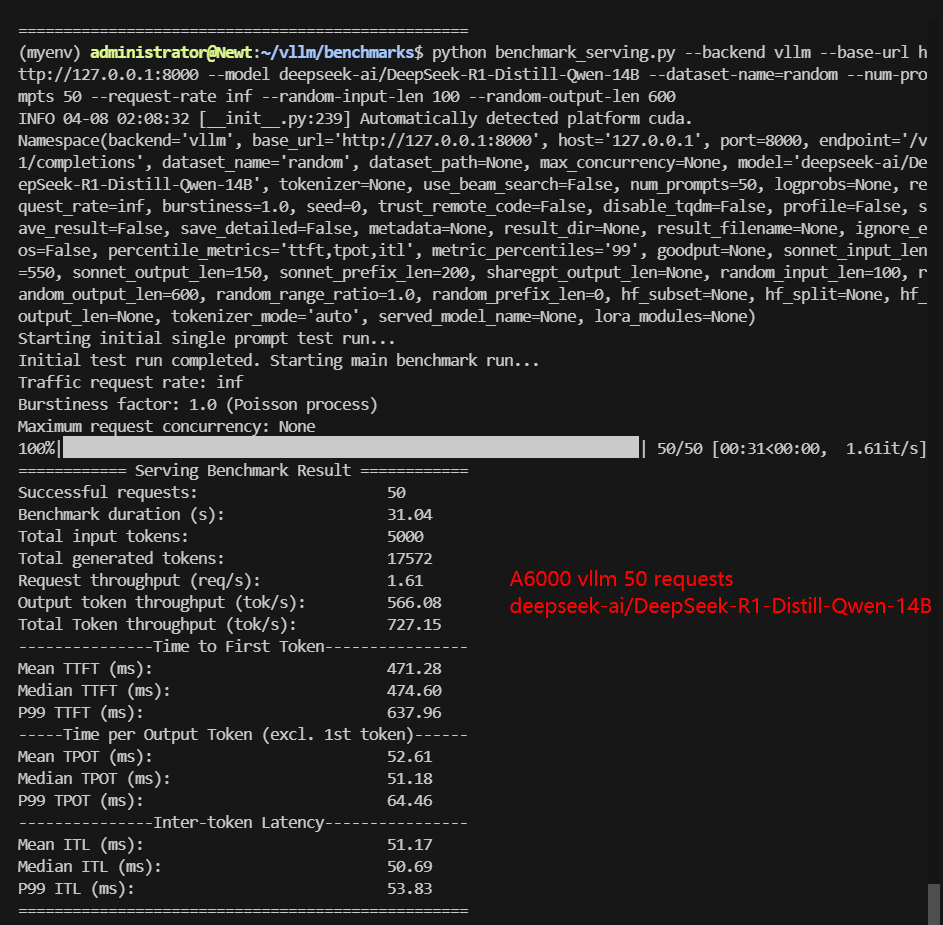
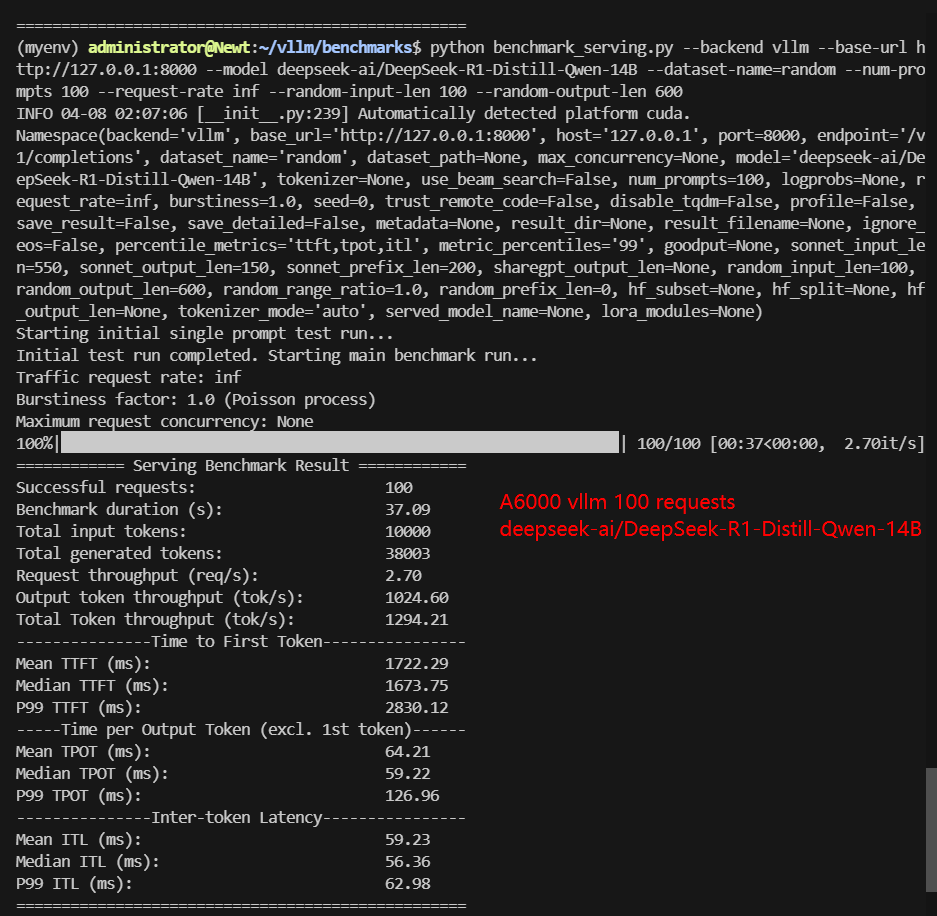
- deepseek-ai/DeepSeek-R1-Distill-Qwen-14B
4. The Test Parameters are Preset as Follows:
- Input length: 100 tokens
- Output length: 600 tokens
5. We conducted two rounds of A6000 vLLM tests under different concurrent request loads:
- Scenario 1: 50 concurrent requests
- Scenario 2: 100 concurrent requests
A6000 Benchmark for Scenario 1: 50 Concurrent Requests
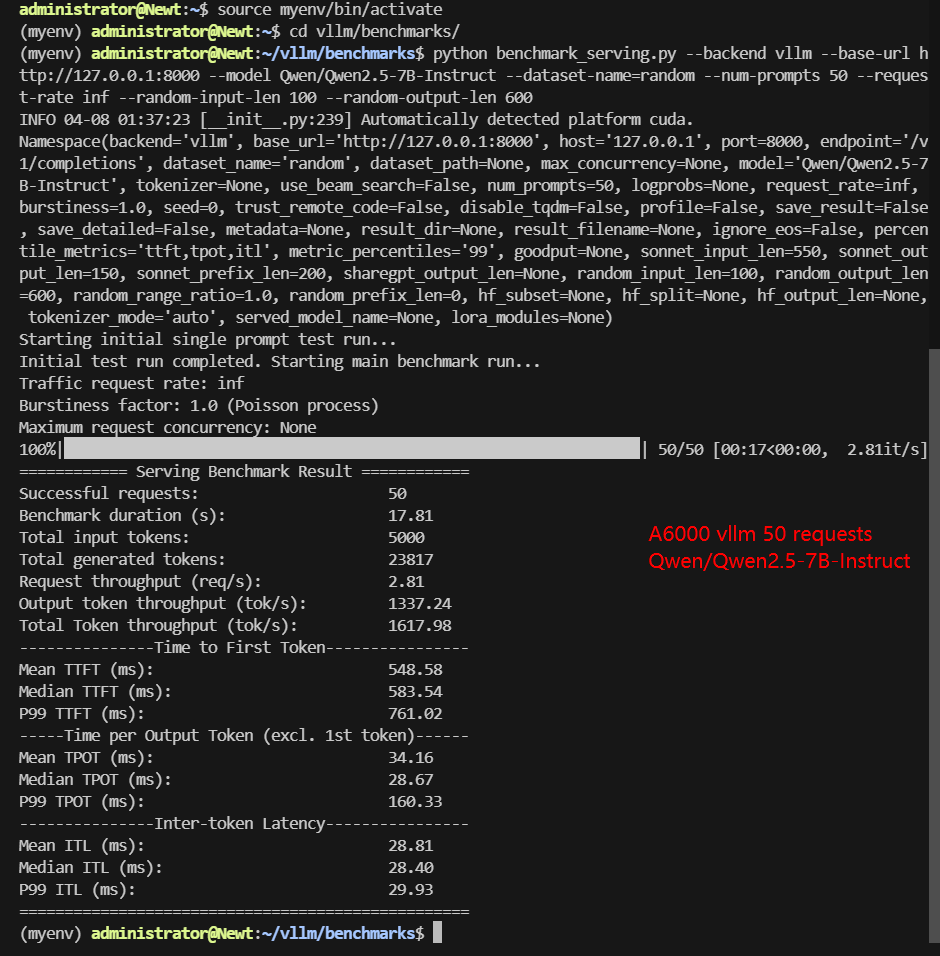
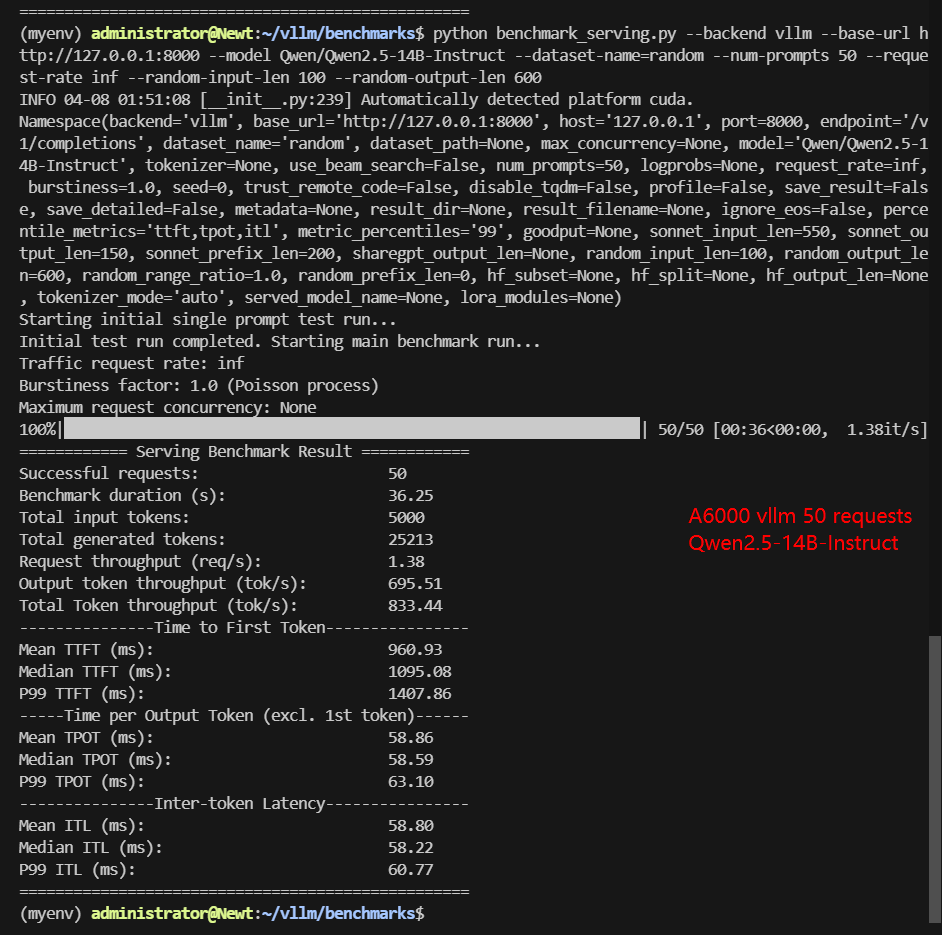
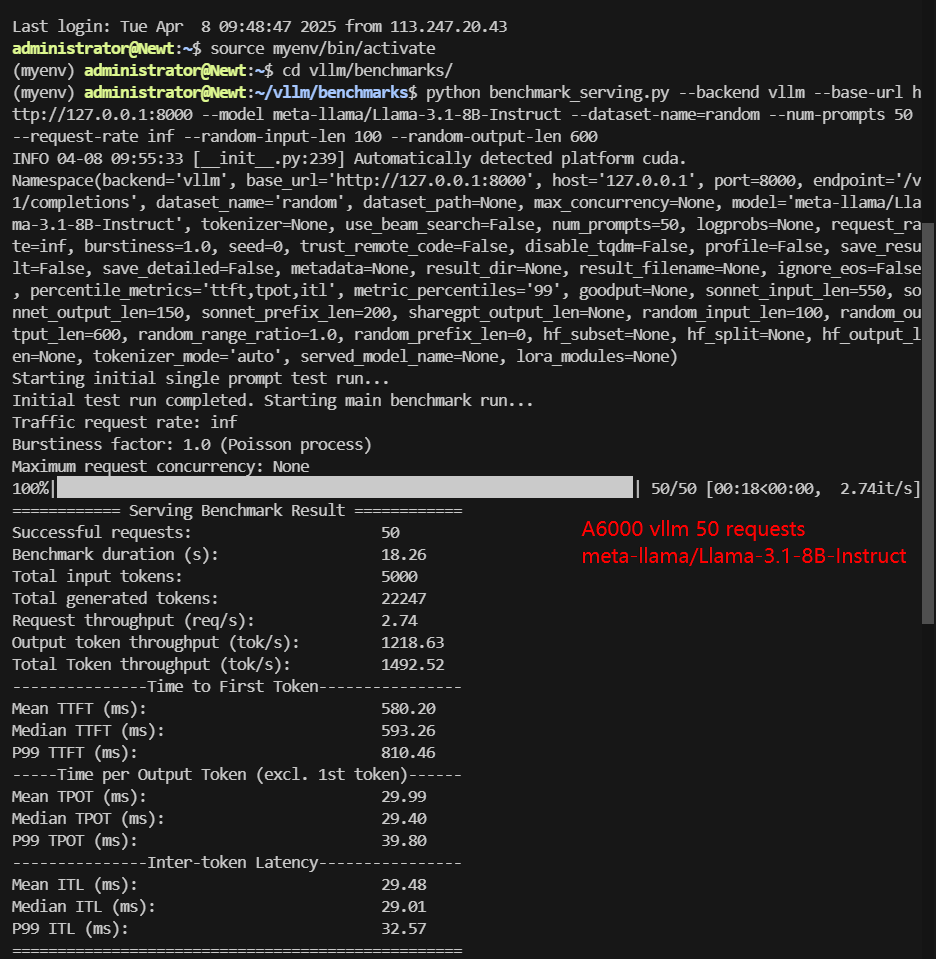
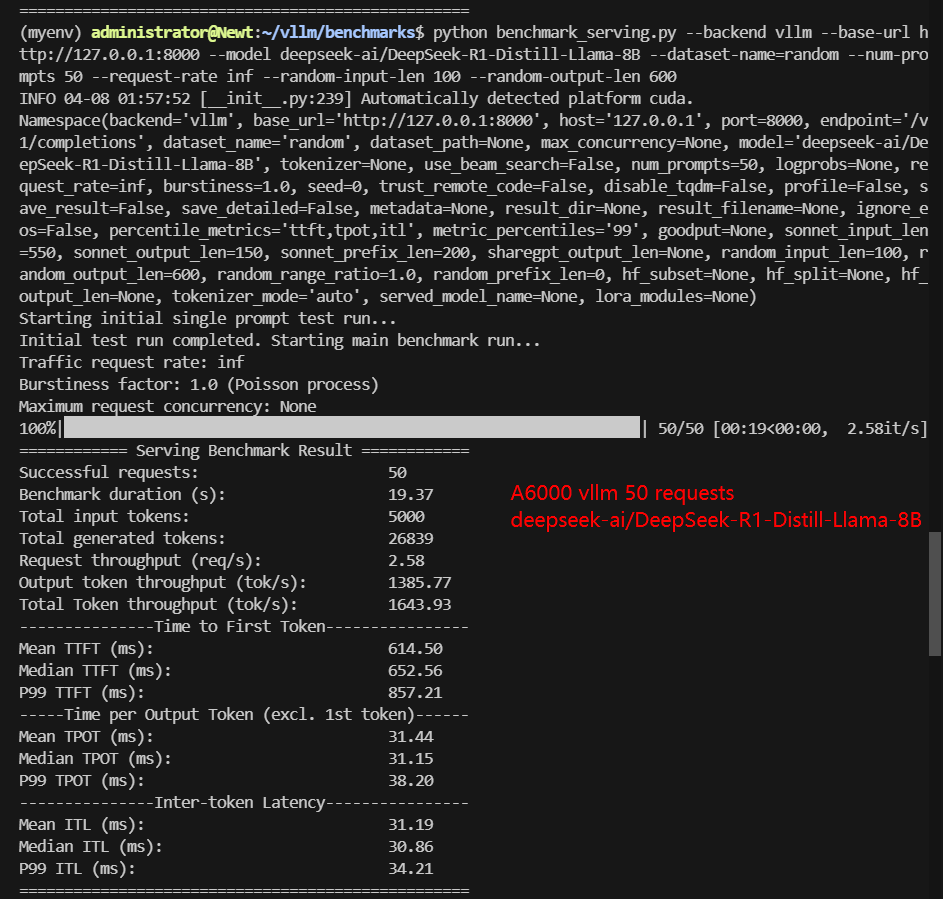
| Models | Qwen2.5-7B-Instruct | Qwen2.5-14B-Instruct | Llama-3.1-8B-Instruct | DeepSeek-R1-Distill-Llama-8B | DeepSeek-R1-Distill-Qwen-14B |
|---|---|---|---|---|---|
| Quantization | 16 | 16 | 16 | 16 | 16 |
| Size(GB) | 15 | 28 | 15 | 15 | 28 |
| Backend/Platform | vLLM | vLLM | vLLM | vLLM | vLLM |
| Request Numbers | 50 | 50 | 50 | 50 | 50 |
| Benchmark Duration(s) | 17.81 | 36.25 | 18.26 | 19.37 | 31.04 |
| Total Input Tokens | 5000 | 5000 | 5000 | 5000 | 5000 |
| Total Generated Tokens | 23817 | 25213 | 22247 | 26839 | 17572 |
| Request (req/s) | 2.81 | 1.38 | 2.74 | 2.58 | 1.61 |
| Input (tokens/s) | 280.74 | 137.93 | 273.89 | 258.16 | 161.07 |
| Output (tokens/s) | 1337.24 | 695.51 | 1218.63 | 1385.77 | 566.08 |
| Total Throughput (tokens/s) | 1617.98 | 833.44 | 1492.52 | 1643.93 | 727.15 |
| Median TTFT(ms) | 583.54 | 1095.08 | 593.26 | 652.56 | 474.60 |
| P99 TTFT(ms) | 761.02 | 1407.86 | 810.46 | 857.21 | 637.96 |
| Median TPOT(ms) | 28.67 | 58.59 | 29.40 | 31.15 | 51.18 |
| P99 TPOT(ms) | 160.33 | 63.10 | 39.80 | 38.20 | 64.46 |
| Median Eval Rate(tokens/s) | 34.88 | 17.07 | 34.01 | 32.10 | 19.54 |
| P99 Eval Rate(tokens/s) | 6.23 | 15.85 | 25.13 | 26.18 | 15.51 |
✅ Key Takeaways:
- The DeepSeek-R1-Distill-LLama-8B model achieved the highest total throughput at 1,643.93 tokens/s.
- Qwen2.5-7B-Instruct followed closely with 1,617.98 tokens/s.
- The larger Qwen2.5-14B-Instruct model showed expectedly lower throughput at 833.44 tokens/s, but this is not a slow speed.
A6000 Benchmark for Scenario 2: 100 Concurrent Requests
| Models | Qwen2.5-7B-Instruct | Qwen2.5-14B-Instruct | Llama-3.1-8B-Instruct | DeepSeek-R1-Distill-Llama-8B | DeepSeek-R1-Distill-Qwen-14B |
|---|---|---|---|---|---|
| Quantization | 16 | 16 | 16 | 16 | 16 |
| Size(GB) | 15 | 28 | 15 | 15 | 28 |
| Backend/Platform | vLLM | vLLM | vLLM | vLLM | vLLM |
| Request Numbers | 50 | 50 | 50 | 50 | 50 |
| Benchmark Duration(s) | 22.41 | 49.77 | 21.52 | 22.51 | 37.09 |
| Total Input Tokens | 10000 | 10000 | 10000 | 10000 | 10000 |
| Total Generated Tokens | 49662 | 51632 | 47223 | 54501 | 38003 |
| Request (req/s) | 4.46 | 2.01 | 4.65 | 4.44 | 2.70 |
| Input (tokens/s) | 446.22 | 200.93 | 464.6 | 444.22 | 269.61 |
| Output (tokens/s) | 2216.02 | 1037.44 | 2193.97 | 2421.04 | 1024.60 |
| Total Throughput (tokens/s) | 2662.24 | 1238.37 | 2658.57 | 2865.26 | 1294.21 |
| Median TTFT(ms) | 414.18 | 804.91 | 543.01 | 585.56 | 1673.75 |
| P99 TTFT(ms) | 950.56 | 1688.46 | 1015.96 | 1086.52 | 2830.12 |
| Median TPOT(ms) | 36.74 | 69.58 | 34.86 | 36.42 | 59.22 |
| P99 TPOT(ms) | 232.43 | 80.00 | 55.98 | 47.82 | 126.96 |
| Median Eval Rate(tokens/s) | 27.22 | 14.37 | 29.68 | 27.46 | 16.89 |
| P99 Eval Rate(tokens/s) | 4.30 | 12.5 | 17.86 | 20.91 | 7.87 |
✅ Key Takeaways:
- DeepSeek-R1-Distill-LLama-8B maintained its lead with 2,865.26 tokens/s.
- LLama-3.1-8B-Instruct showed strong scaling at 2,658.57 tokens/s.
- Qwen2.5-14B-Instruct remained the slowest at 1,238.37 tokens/s. Compared with 833.44 tokens/second for 50 concurrent requests, it has improved a lot, indicating that it has not reached the bottleneck when 50 concurrent requests are received. A6000 can support 100 concurrent requests for the 14b model.
Insights for A6000 vLLM Performance
✅ Model Size Considerations
✅ Supports 14B Models with High Concurrency
✅ Best Performer: DeepSeek R1-8B
✅ LLaMA 3-8B is a Sweet Spot
Get Started with RTX A6000 Server Rental!
Interested in optimizing your vLLM deployment? Check out our cheap GPU server hosting services or explore alternative GPUs for high-end AI inference.
Enterprise GPU Dedicated Server - RTX A6000
- 256GB RAM
- Dual 18-Core E5-2697v4
- 240GB SSD + 2TB NVMe + 8TB SATA
- 100Mbps-1Gbps
- OS: Windows / Linux
- GPU: Nvidia Quadro RTX A6000
- Microarchitecture: Ampere
- CUDA Cores: 10,752
- Tensor Cores: 336
- GPU Memory: 48GB GDDR6
- FP32 Performance: 38.71 TFLOPS
- Optimally running AI, deep learning, data visualization, HPC, etc.
Enterprise GPU Dedicated Server - RTX 4090
- 256GB RAM
- Dual 18-Core E5-2697v4
- 240GB SSD + 2TB NVMe + 8TB SATA
- 100Mbps-1Gbps
- OS: Windows / Linux
- GPU: GeForce RTX 4090
- Microarchitecture: Ada Lovelace
- CUDA Cores: 16,384
- Tensor Cores: 512
- GPU Memory: 24 GB GDDR6X
- FP32 Performance: 82.6 TFLOPS
- Perfect for 3D rendering/modeling , CAD/ professional design, video editing, gaming, HPC, AI/deep learning.
Enterprise GPU Dedicated Server - A100
- 256GB RAM
- Dual 18-Core E5-2697v4
- 240GB SSD + 2TB NVMe + 8TB SATA
- 100Mbps-1Gbps
- OS: Windows / Linux
- GPU: Nvidia A100
- Microarchitecture: Ampere
- CUDA Cores: 6912
- Tensor Cores: 432
- GPU Memory: 40GB HBM2
- FP32 Performance: 19.5 TFLOPS
- Good alternativeto A800, H100, H800, L40. Support FP64 precision computation, large-scale inference/AI training/ML.etc
Enterprise GPU Dedicated Server - A100(80GB)
- 256GB RAM
- Dual 18-Core E5-2697v4
- 240GB SSD + 2TB NVMe + 8TB SATA
- 100Mbps-1Gbps
- OS: Windows / Linux
- GPU: Nvidia A100
- Microarchitecture: Ampere
- CUDA Cores: 6912
- Tensor Cores: 432
- GPU Memory: 80GB HBM2e
- FP32 Performance: 19.5 TFLOPS
⚠️Notes: Gemma 3-12B is not compatible with A6000
Conclusion: A6000 is the Cheapest Choice for 7B-14B LLMs
The benchmark results demonstrate that A6000 GPUs with vLLM backend can effectively host medium-sized LLMs (7B-14B parameters) for production workloads. The DeepSeek-R1-Distill-LLama-8B model showed particularly strong performance across all metrics, making it an excellent choice for A6000 deployments requiring balanced throughput and latency.
For applications prioritizing throughput over model size, the 7B/8B class models generally provide better performance characteristics on A6000 hardware. The 14B models remain viable for applications where model capability outweighs pure performance metrics.
Attachment: Video Recording of A6000 vLLM Benchmark
Data Item Explanation in the Table:
- Quantization: The number of quantization bits. This test uses 16 bits, a full-blooded model.
- Size(GB): Model size in GB.
- Backend: The inference backend used. In this test, vLLM is used.
- Successful Requests: The number of requests processed.
- Benchmark duration(s): The total time to complete all requests.
- Total input tokens: The total number of input tokens across all requests.
- Total generated tokens: The total number of output tokens generated across all requests.
- Request (req/s): The number of requests processed per second.
- Input (tokens/s): The number of input tokens processed per second.
- Output (tokens/s): The number of output tokens generated per second.
- Total Throughput (tokens/s): The total number of tokens processed per second (input + output).
- Median TTFT(ms): The time from when the request is made to when the first token is received, in milliseconds. A lower TTFT means that the user is able to get a response faster.
- P99 TTFT (ms): The 99th percentile Time to First Token, representing the worst-case latency for 99% of requests—lower is better to ensure consistent performance.
- Median TPOT(ms): The time required to generate each output token, in milliseconds. A lower TPOT indicates that the system is able to generate a complete response faster.
- P99 TPOT (ms): The 99th percentile Time Per Output Token, showing the worst-case delay in token generation—lower is better to minimize response variability.
- Median Eval Rate(tokens/s): The number of tokens evaluated per second per user. A high evaluation rate indicates that the system is able to serve each user efficiently.
- P99 Eval Rate(tokens/s): The number of tokens evaluated per second by the 99th percentile user represents the worst user experience.
A6000 vLLM benchmark, vLLM A6000 performance, A6000 LLMs multi-concurrency, A6000 hosting LLMs, Qwen vs LLaMA-3 A6000, DeepSeek-R1 A6000 benchmark, Best LLM for A6000, A6000 token throughput, LLM inference speed A6000, vLLM vs Ollama A6000