


Video: Pro2000 vLLM Benchmark with Hugging Face LLMs

NVIDIA RTX Pro 2000 Blackwell vLLM Inference Benchmark
This benchmark evaluates the NVIDIA RTX Pro 2000 Blackwell GPU as a single-GPU inference platform using vLLM, with a focus on throughput, latency, and request-level performance under continuous batching.
The goal of this test is to understand how a 16GB-class professional GPU performs when serving small to mid-size language models in real inference conditions.
Test Overview
Hardware and Software Stack
- GPU: Nvidia RTX Pro 2000 Blackwell Server Edition
- Inference Engine: vLLM
- Backend: CUDA + vLLM Continuous Batching
- Parallelism: --tensor-parallel-size = 1, Single-GPU inference, no model sharding
Pro 2000 GPU Details
- Microarchitecture: Blackwell
- Compute capability: 12
- CUDA Cores: 4352
- Tensor Cores: 5th Gen
- GPU Memory: 16GB GDDR7
- FP32 Performance: 17 TFLOPS
Benchmark Tool
Benchmark tests were executed using the official vLLM repository:
git clone https://github.com/vllm-project/vllm.gitThe benchmark_serving.py script was used for all measurements.
Unified Benchmark Parameters
All models were tested with the same inference load configuration to ensure fair comparison:
--max-model-len 4096
--tensor-parallel-size 1
--num-prompts 50
--request-rate inf
--random-input-len 100
--random-output-len 600
This configuration simulates a realistic API / chat inference workload with moderate concurrency and long-form outputs.
Models Tested
The benchmark includes a mix of mainstream open-source models and quantized variants deployed from Hugging Face:
- deepseek-ai/DeepSeek-R1-Distill-Qwen-1.5B (FP16)
- Qwen/Qwen2.5-1.5B-Instruct (FP16)
- Qwen/Qwen3-VL-2B-Instruct (FP16)
- Qwen/Qwen3-4B (FP16)
- google/gemma-3-4b-it (FP16)
All models were served using vLLM with identical runtime parameters to ensure comparability.
Key Performance Results: Pro2000 vLLM Benchmark
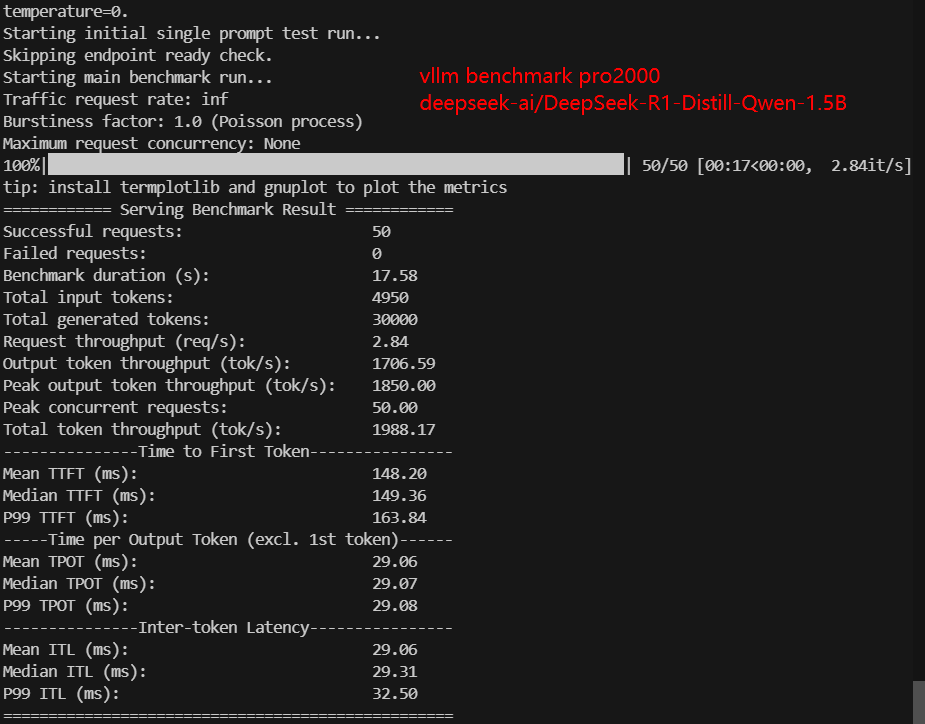
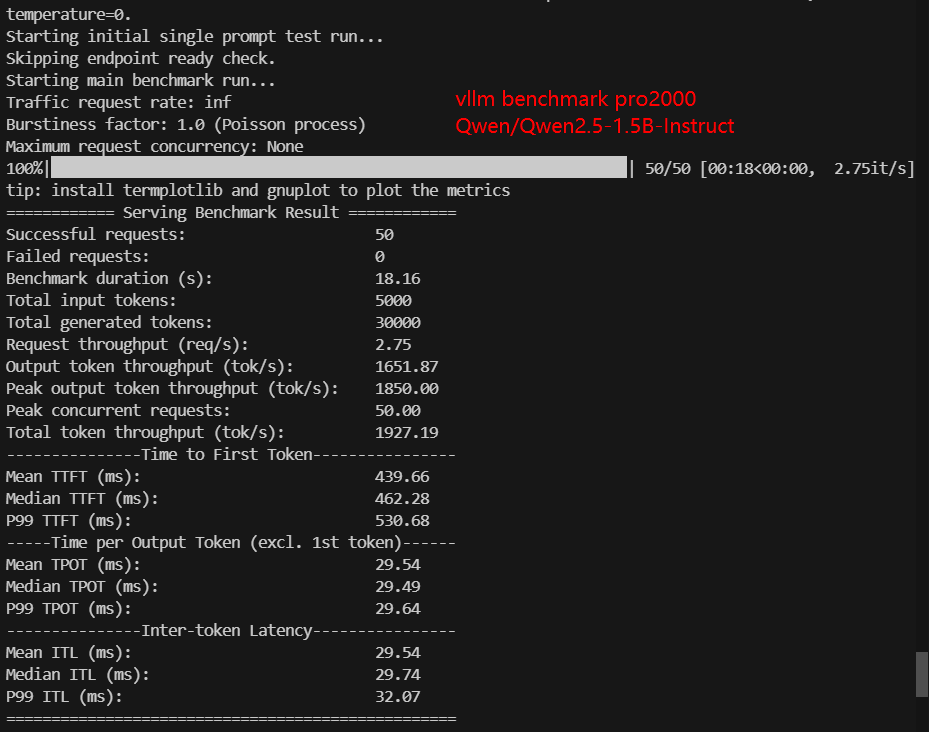
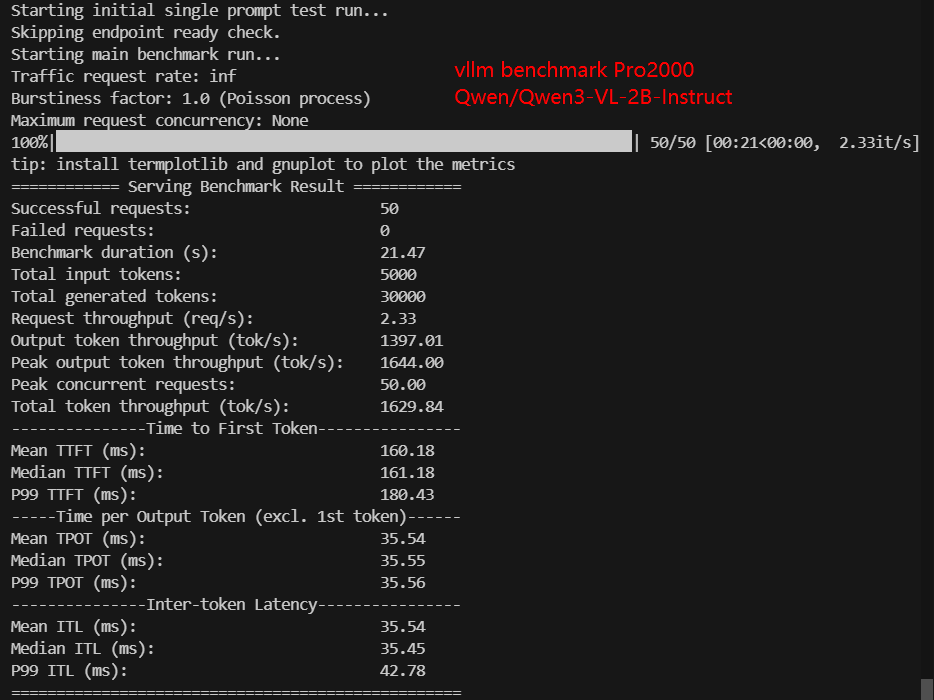
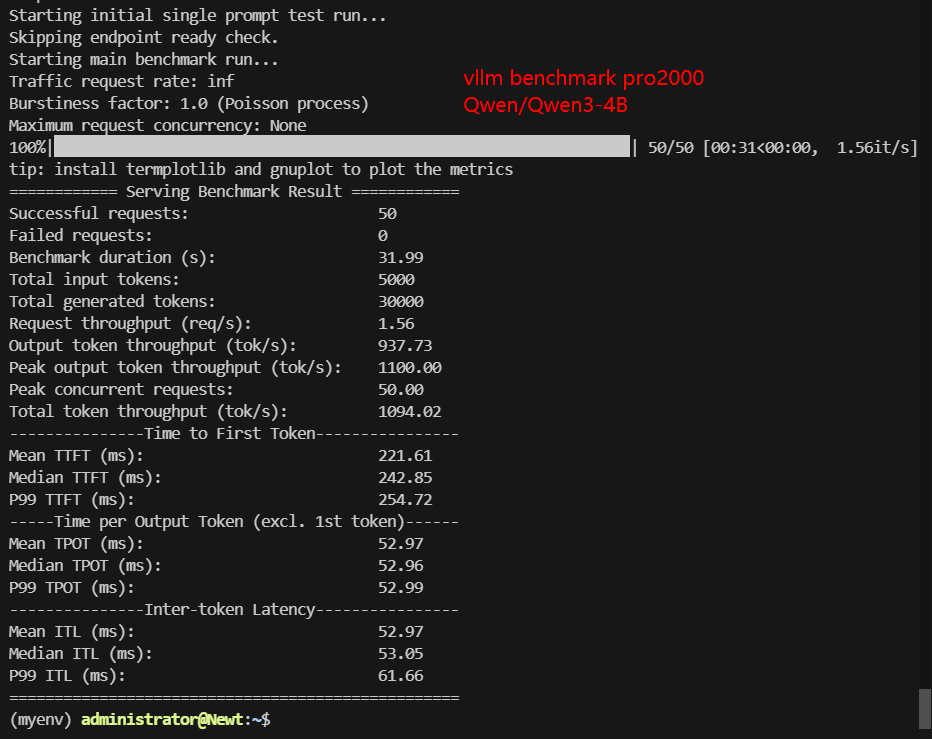
| Models | DeepSeek-R1-Distill-Qwen-1.5B | Qwen2.5-1.5B-Instruct | Qwen3-VL-2B-Instruct | Qwen3-4B | gemma-3-4b-it |
|---|---|---|---|---|---|
| Quantization | 16 | 16 | 16 | 16 | 16 |
| Size(GB) | 3.4GB | 2.9GB | 4.0GB | 7.6GB | 8.1GB |
| Backend/Platform | vLLM | vLLM | vLLM | vLLM | vLLM |
| Request Numbers | 50 | 50 | 50 | 50 | 50 |
| Benchmark Duration(s) | 17.58 | 18.16 | 21.47 | 31.99 | 47.85 |
| Total input tokens | 4950 | 5000 | 5000 | 5000 | 5000 |
| Total Generated Tokens | 30000 | 30000 | 30000 | 30000 | 30000 |
| Request (req/s) | 2.84 | 2.75 | 2.33 | 1.56 | 1.04 |
| Input (tokens/s) | 281.58 | 275.32 | 232.83 | 156.29 | 103.46 |
| Output (tokens/s) | 1706.59 | 1651.87 | 1397.01 | 937.73 | 626.98 |
| Total Throughput (tokens/s) | 1988.17 | 1927.19 | 1629.84 | 1094.02 | 730.44 |
| Median TTFT(ms) | 149.36 | 462.28 | 161.18 | 242.85 | 2900.68 |
| P99 TTFT (ms) | 163.84 | 530.68 | 180.43 | 254.72 | 3017.71 |
| Median TPOT(ms) | 29.07 | 29.49 | 35.55 | 52.96 | 54.30 |
| P99 TPOT(ms) | 29.08 | 29.64 | 35.56 | 52.99 | 74.75 |
| Median ITL (ms) | 29.31 | 29.74 | 35.45 | 53.05 | 53.28 |
| P99 ITL (ms) | 32.50 | 32.07 | 42.78 | 61.66 | 57.69 |
Throughput Performance
Total Throughput (tokens/s)
The throughput results show a clear scaling trend as model size increases:
- 1.5B-class models achieve nearly 2,000 tokens/s, making them highly suitable for high-QPS inference.
- 2B models maintain strong throughput at ~1,600 tokens/s.
- 4B models show a predictable drop, operating between 1,100 and 730 tokens/s, depending on architecture and attention efficiency.
Among all tested models:
- DeepSeek-R1-Distill-Qwen-1.5B delivers the highest total throughput.
- Gemma-3-4B-IT shows the lowest throughput, reflecting its heavier decoder and higher per-token cost.
Latency Characteristics
Time to First Token (TTFT)
- Most models maintain sub-300 ms median TTFT, which is acceptable for interactive inference.
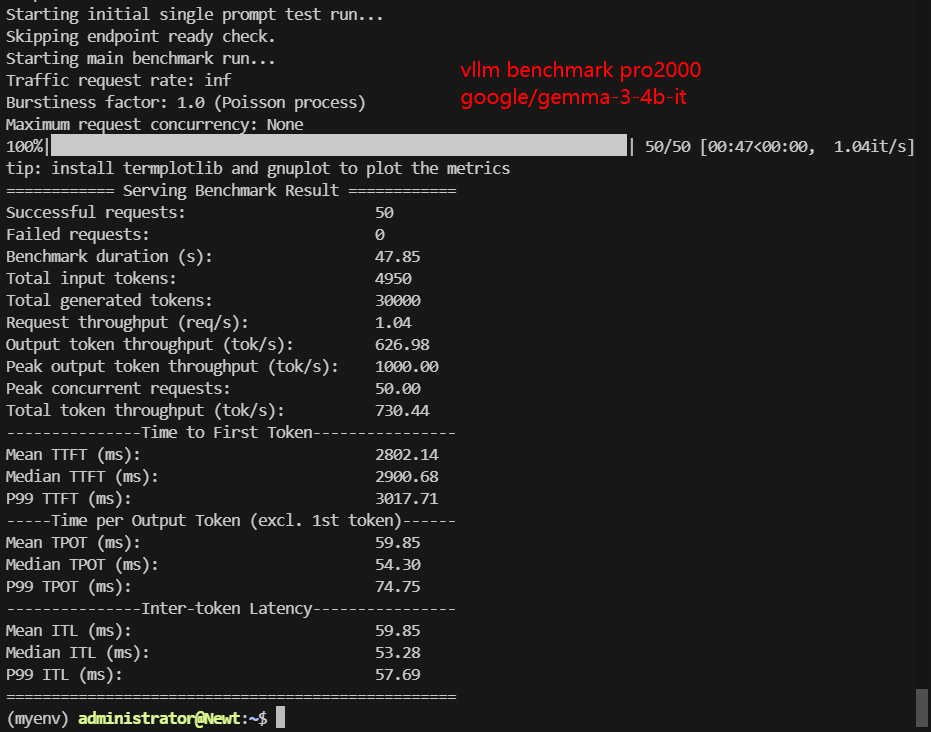
- Gemma-3-4B-IT exhibits significantly higher TTFT, exceeding 2.9 seconds, indicating higher initialization and prefill overhead.
Token Generation Latency
- Smaller models maintain ~30 ms per token.
- 4B models move into the 50–55 ms per token range.
- P99 latency remains stable across most models, suggesting consistent scheduling behavior under continuous batching.
Request Handling Efficiency
Under --request-rate inf, RTX Pro 2000 maintains:
- 2.7–2.8 requests/s for 1.5B models
- ~1 request/s for 4B models
This confirms that the GPU is fully saturated and operating in a throughput-bound regime rather than being limited by CPU or I/O.
Key Observations
1. RTX Pro 2000 is well-matched with 1.5B–2B models
These models achieve excellent throughput and low latency, making them ideal for chatbots, agents, and API-style inference.
2. 4B models are usable but throughput-limited
They remain viable for lower-QPS workloads or internal services, but are less suited for high-concurrency serving.
3. Architecture matters more than size alone
Models with similar parameter counts can differ significantly in TTFT and throughput.
4. vLLM continuous batching efficiently saturates the GPU
GPU utilization remains high and latency distributions remain stable under load.
Conclusion
The NVIDIA RTX Pro 2000 Blackwell, when paired with vLLM, delivers strong inference performance for small and mid-size language models.
For deployments targeting cost-efficient GPU VPS, internal tools, or lightweight LLM services, RTX Pro 2000 provides a balanced combination of throughput, latency, and stability.
Recommended usage
- High-QPS inference: 1.5B–2B models
- Balanced workloads: up to 4B models
- Not recommended: large-scale or long-context heavy models
Overall, RTX Pro 2000 is best positioned as an entry-level inference GPU optimized for efficient, batched LLM serving.
Only $99/mo, Rent Pro 2000 Blackwell Server!
Attachment: Video Recording of Pro2000 vLLM Benchmark
Screenshot: Pro2000 vLLM Benchmark Results
Data Item Explanation in the Table
- Quantization: Indicates the numerical precision used for model weights, affecting memory usage and inference speed.
- Size (GB): Represents the approximate model memory footprint under the specified quantization, not necessarily peak GPU VRAM usage.
- Backend / Platform: Specifies the inference engine and runtime environment used for the benchmark.
- Tensor Parallel Size: Shows how many GPUs are used to run the model, with 1 meaning single-GPU inference.
- Max Model Length: Defines the maximum supported token length for input and output combined.
- Request Numbers: Indicates the total number of inference requests issued during the benchmark.
- Benchmark Duration (s): Measures the total time required to complete all benchmark requests.
- Total Input Tokens: The sum of all prompt tokens processed across requests.
- Total Generated Tokens: The total number of output tokens generated during the benchmark.
- Requests (req/s): Represents how many inference requests the system can handle per second.
- Input Throughput (tokens/s): Measures the rate at which input tokens are processed.
- Output Throughput (tokens/s): Measures the rate at which output tokens are generated.
- Total Throughput (tokens/s): Combines input and output token throughput to reflect overall inference efficiency.
- Median TTFT (ms): The median time from request submission to the first generated token.
- P99 TTFT (ms): The 99th-percentile time to first token, reflecting worst-case initial latency.
- Median TPOT (ms): The median time required to generate each output token after the first token.
- P99 TPOT (ms): The 99th-percentile per-token generation latency under load.
- Median ITL (ms): The median delay between consecutive output tokens during streaming generation.
- P99 ITL (ms): The 99th-percentile inter-token delay, indicating tail latency during output streaming.
Keywords:
RTX Pro 2000 Blackwell benchmark, vLLM inference test, Pro2000 vLLM, GPU inference benchmark, vLLM benchmark, small LLM inference GPU
Outline