
Video: Pro6000 vLLM Benchmark with Hugging Face LLMs

Pro 6000 GPU vLLM Inference Benchmark Report: Pro6000 vs. H100 vs. A100-80GB
As large language models increasingly move into production inference workloads, throughput stability, latency behavior, and memory efficiency have become more important than raw theoretical FLOPS.
This report evaluates the real-world inference performance of a Pro 6000 GPU using the vLLM inference engine, benchmarking a range of popular Hugging Face models from 8B to 120B parameters under identical load conditions.
Test Environment and Methodology
Hardware and Software Stack
- GPU: Nvidia RTX Pro 6000 Blackwell Server Edition
- Inference Engine: vLLM
- Backend: CUDA + vLLM Continuous Batching
- Parallelism: --tensor-parallel-size = 1, Single-GPU inference, no model sharding
Pro 6000 GPU Details
- GPU: Nvidia RTX Pro 6000 Blackwell Server Edition
- Microarchitecture: Blackwell
- Compute capability: 12
- CUDA Cores: 24,064
- Tensor Cores: 852
- GPU Memory: 96GB GDDR7
- FP32 Performance: 126 TFLOPS
Benchmark Tool
Benchmark tests were executed using the official vLLM repository:
git clone https://github.com/vllm-project/vllm.gitThe benchmark_serving.py script was used for all measurements.
Unified Benchmark Parameters
All models were tested with the same inference load configuration to ensure fair comparison:
--max-model-len 4096
--tensor-parallel-size 1
--num-prompts 50
--request-rate inf
--random-input-len 100
--random-output-len 600
This configuration simulates a realistic API / chat inference workload with moderate concurrency and long-form outputs.
Model Coverage
The benchmark includes three representative model tiers. Models download from Hugging Face:
Small Models (8B Class)
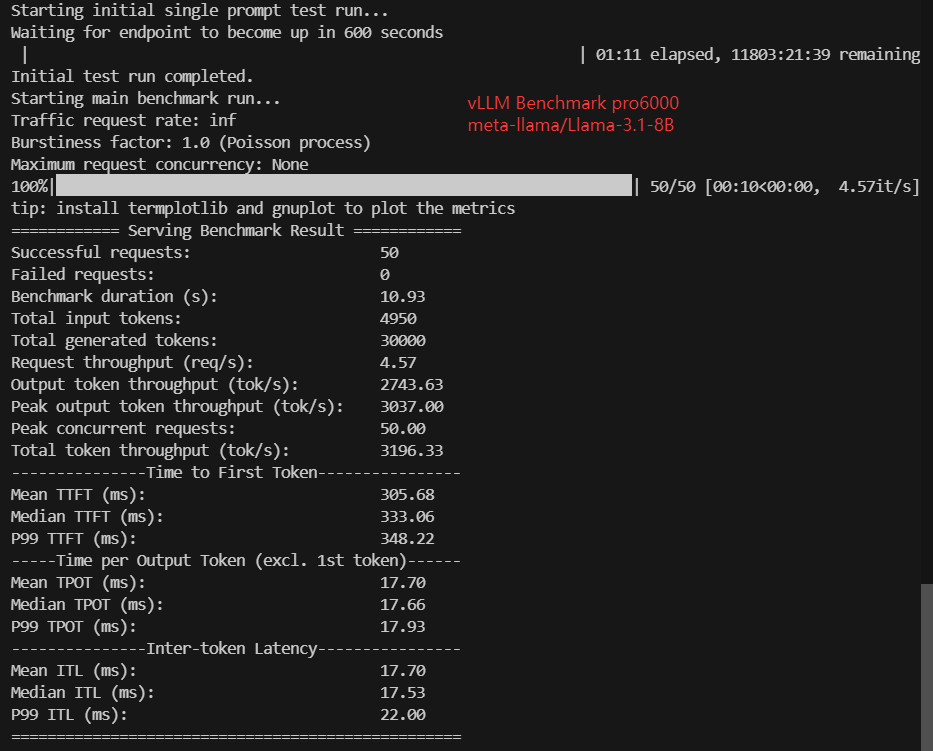
- meta-llama/Llama-3.1-8B (15 GB)
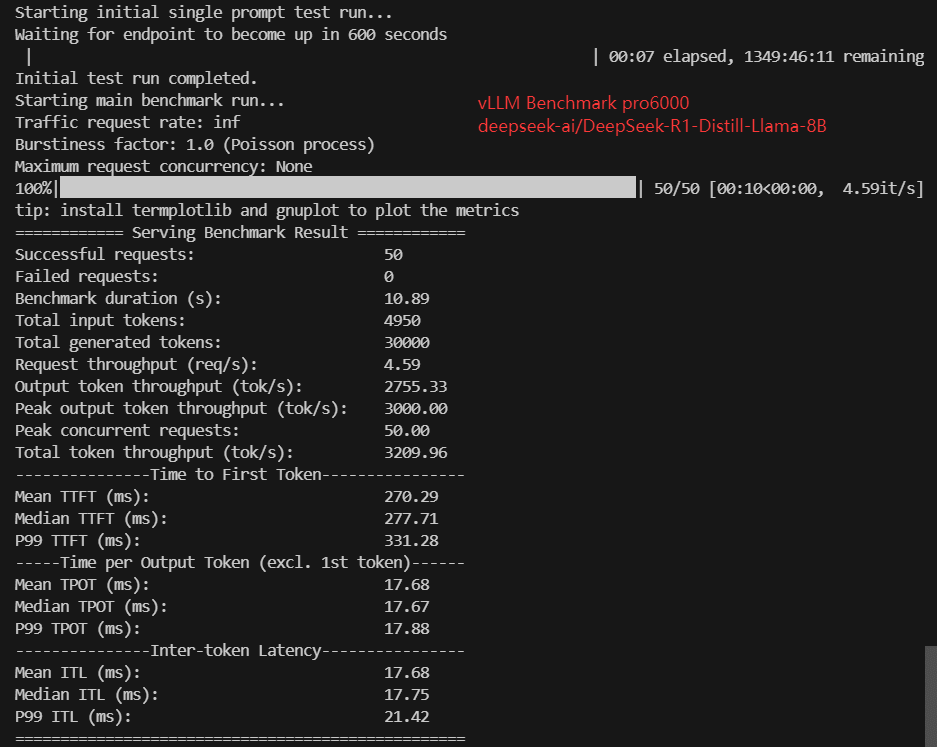
- deepseek-ai/DeepSeek-R1-Distill-Llama-8B (15GB)
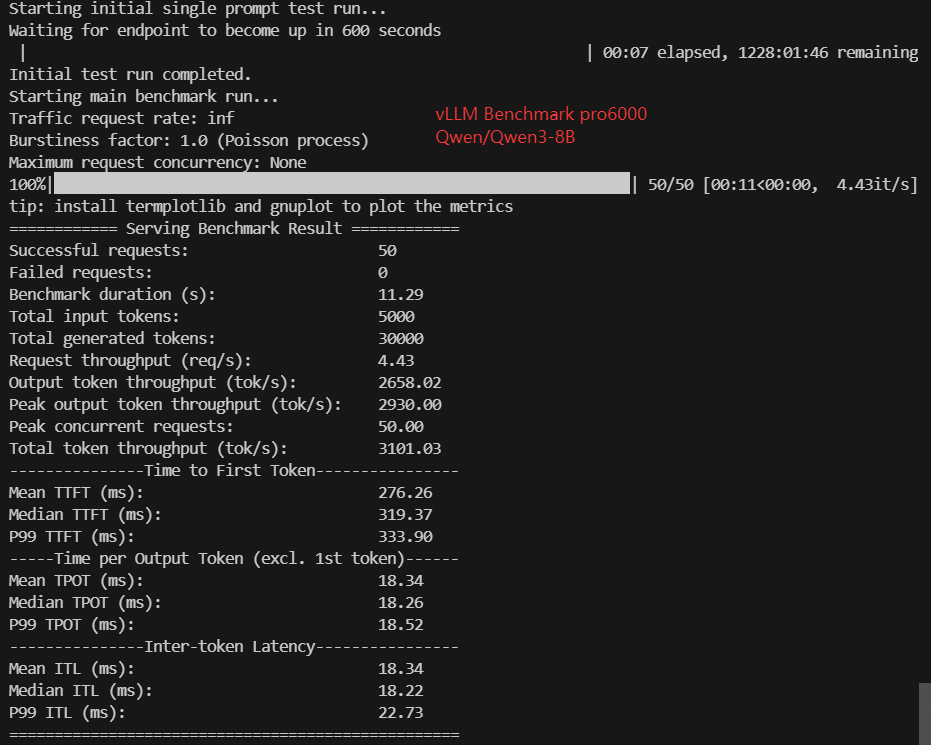
- Qwen/Qwen3-8B (15GB)
Medium Models (12B–20B Class)
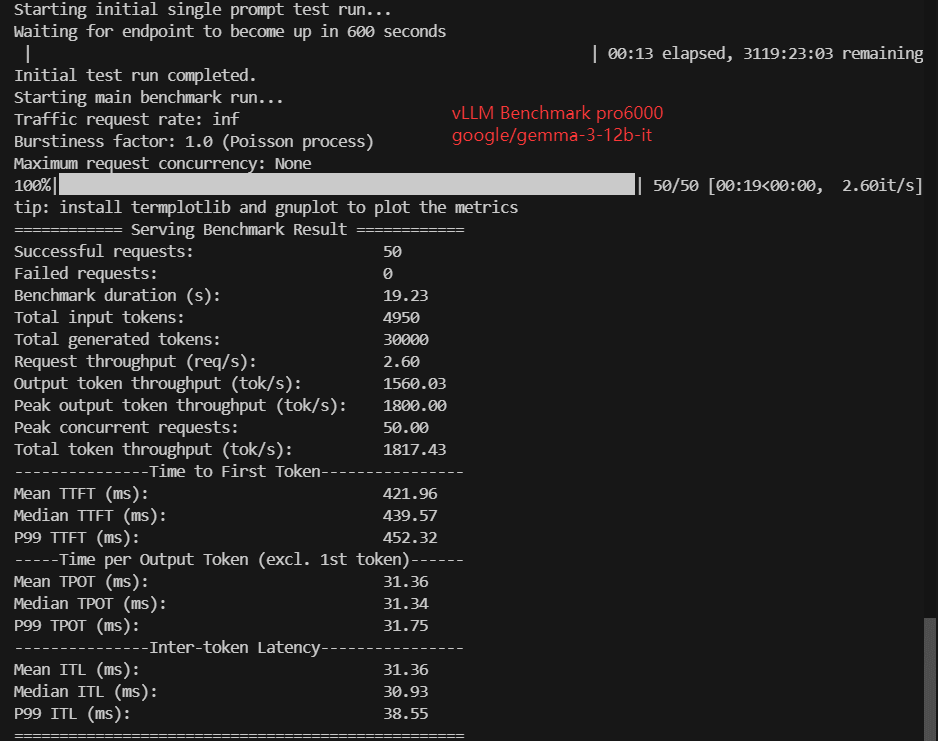
- google/gemma-3-12b-it (23GB)
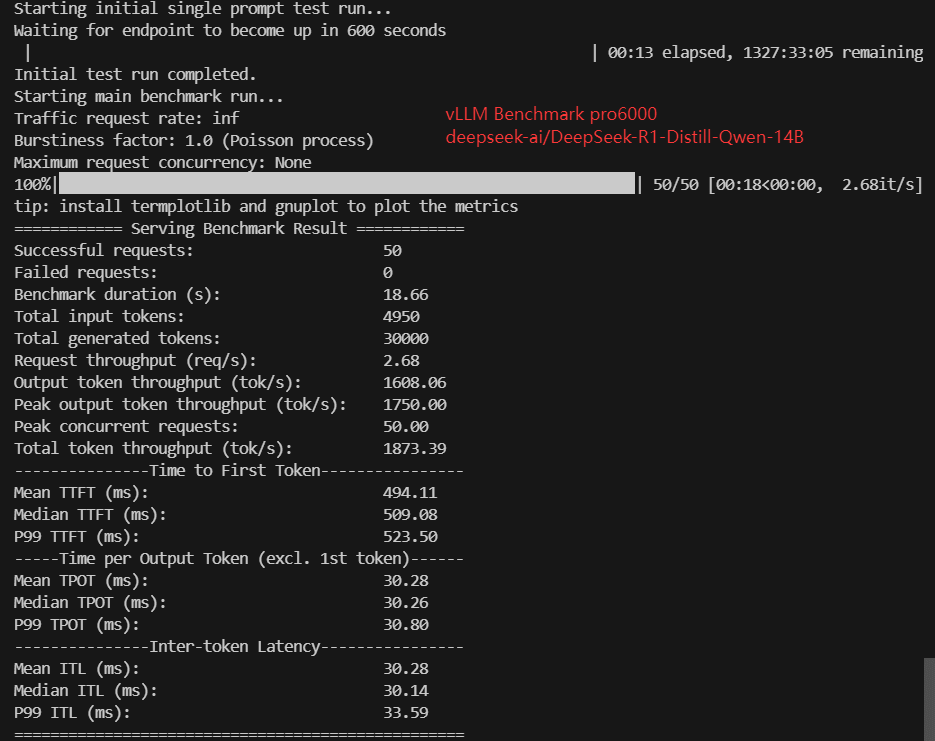
- deepseek-ai/DeepSeek-R1-Distill-Qwen-14B (28 GB)
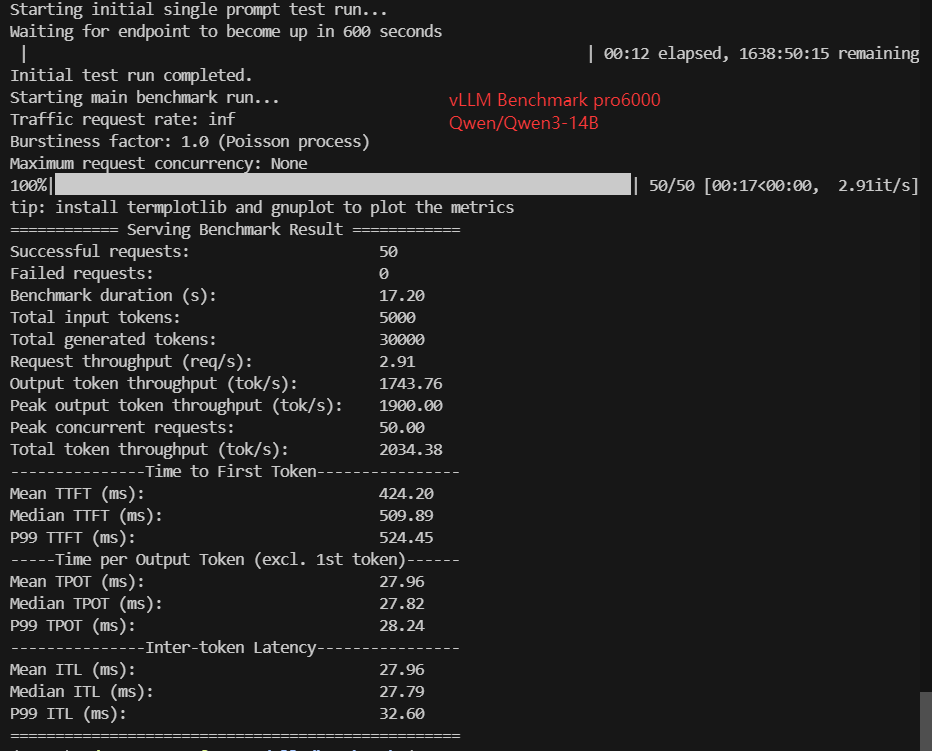
- Qwen/Qwen3-14B (28 GB)
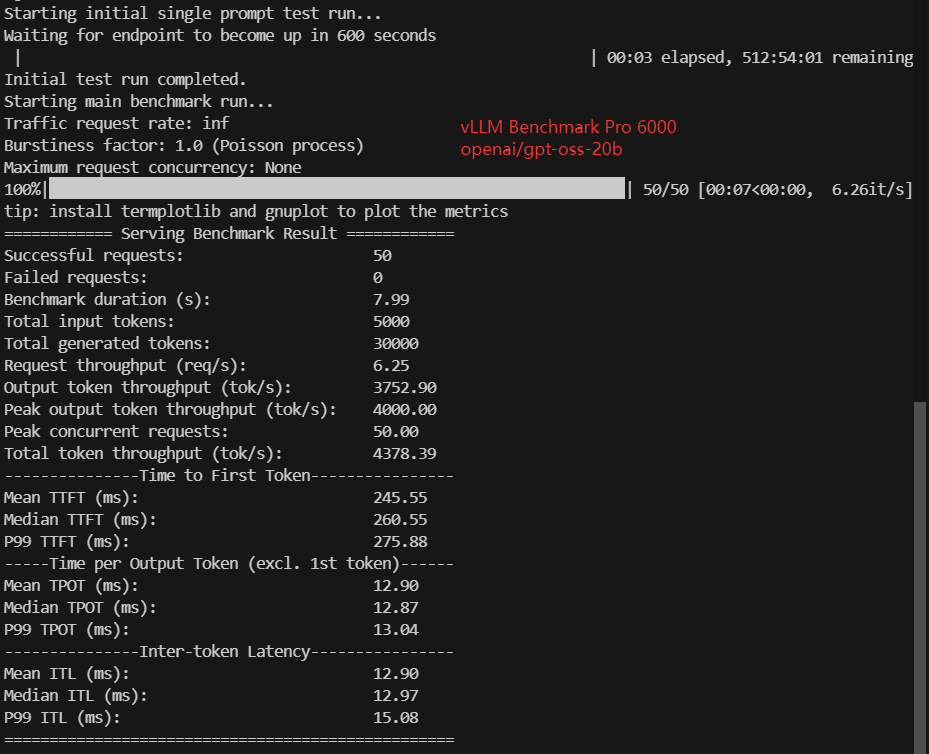
- openai/gpt-oss-20b (4-bit, 13GB)
Large Models (32B–120B Class)
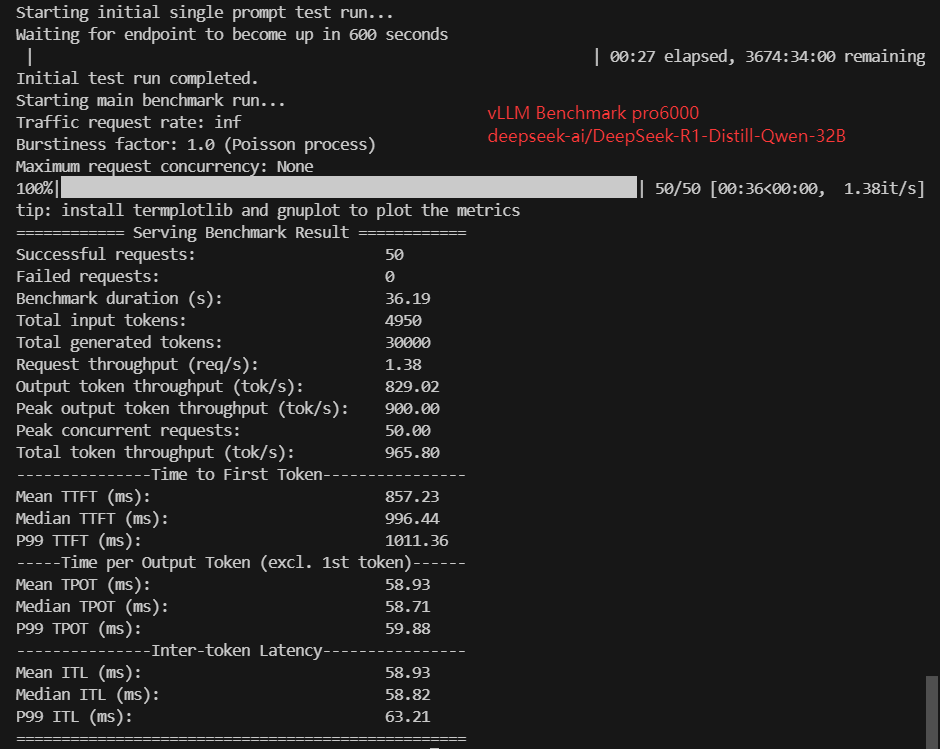
- deepseek-ai/DeepSeek-R1-Distill-Qwen-32B (62GB)
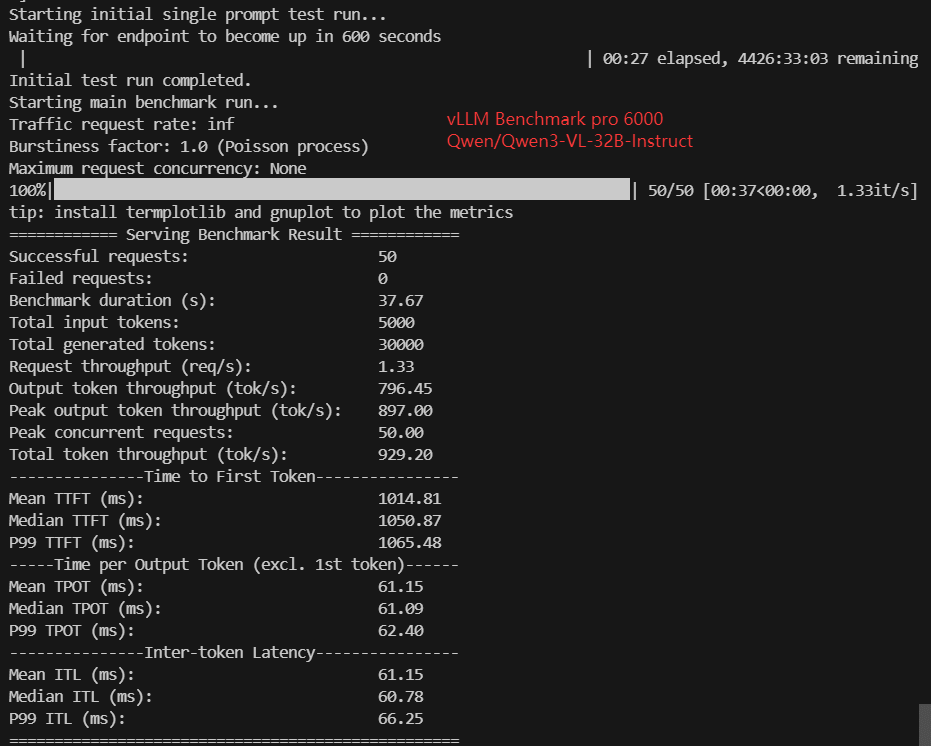
- Qwen/Qwen3-VL-32B-Instruct (63GB)
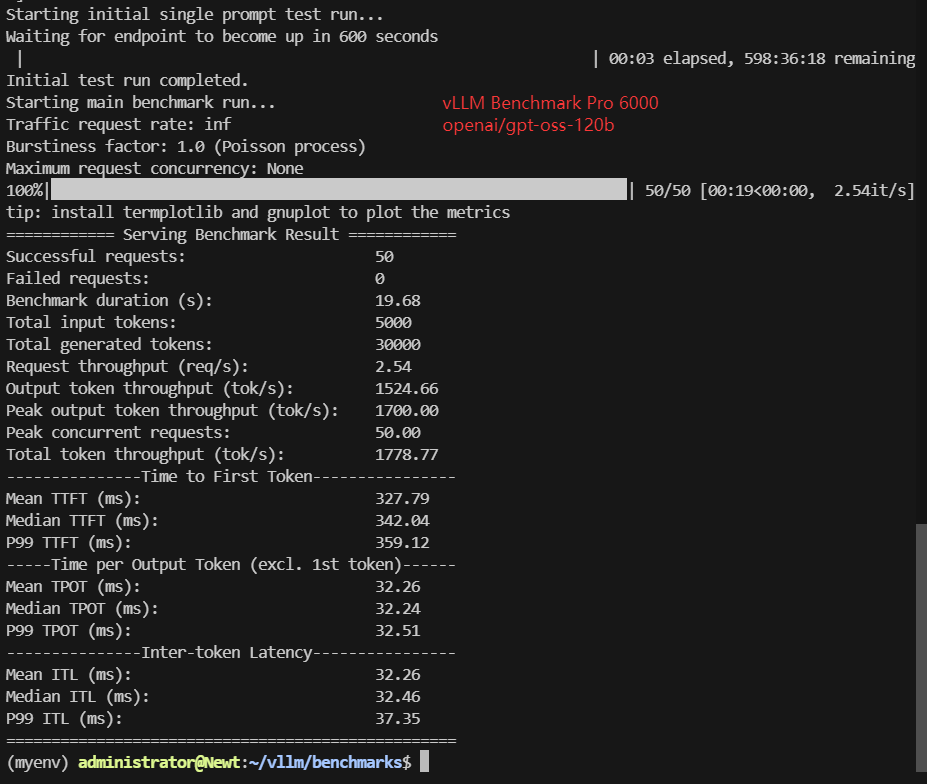
- openai/gpt-oss-120b (4-bit, 61 GB)
Key Performance Results: Pro6000 vLLM Benchmark
| Models | Llama-3.1-8B | gemma-3-12b-it | gpt-oss-20b | gpt-oss-120b | DeepSeek-R1-Distill-Llama-8B | DeepSeek-R1-Distill-Qwen-14B | DeepSeek-R1-Distill-Qwen-32B | Qwen3-8B | Qwen3-14B | Qwen3-VL-32B-Instruct |
|---|---|---|---|---|---|---|---|---|---|---|
| Quantization | 16 | 16 | 8 | 8 | 16 | 16 | 16 | 16 | 16 | 16 |
| Size(GB) | 15GB | 23GB | 13GB | 61GB | 15GB | 28GB | 62GB | 15GB | 28GB | 63GB |
| Backend/Platform | vLLM | vLLM | vLLM | vLLM | vLLM | vLLM | vLLM | vLLM | vLLM | vLLM |
| Request Numbers | 50 | 50 | 50 | 50 | 50 | 50 | 50 | 50 | 50 | 50 |
| Benchmark Duration(s) | 10.93 | 19.23 | 7.99 | 19.68 | 10.89 | 18.66 | 36.19 | 11.29 | 17.20 | 37.67 |
| Total input tokens | 4950 | 4950 | 5000 | 5000 | 5000 | 4950 | 5000 | 5000 | 5000 | 5000 |
| Total Generated Tokens | 30000 | 30000 | 30000 | 30000 | 30000 | 30000 | 30000 | 30000 | 30000 | 30000 |
| Request (req/s) | 4.57 | 2.60 | 6.25 | 2.54 | 4.59 | 2.68 | 1.38 | 4.43 | 2.91 | 1.33 |
| Input (tokens/s) | 452.7 | 257.4 | 625.49 | 254.11 | 454.63 | 265.33 | 136.78 | 443.01 | 290.62 | 132.95 |
| Output (tokens/s) | 2743.63 | 1560.03 | 3752.90 | 1524.66 | 2755.33 | 1608.06 | 829.02 | 2658.02 | 1743.76 | 796.45 |
| Total Throughput (tokens/s) | 3196.33 | 1817.43 | 4378.39 | 1778.77 | 3209.96 | 1873.39 | 965.80 | 3101.03 | 2034.38 | 929.20 |
| Median TTFT(ms) | 333.06 | 439.57 | 260.55 | 342.04 | 277.71 | 509.08 | 996.44 | 319.37 | 509.89 | 1050.87 |
| P99 TTFT (ms) | 348.22 | 452.32 | 275.88 | 359.12 | 331.28 | 523.50 | 1011.36 | 333.90 | 524.45 | 1065.48 |
| Median TPOT(ms) | 17.66 | 31.34 | 12.87 | 32.24 | 17.67 | 30.26 | 58.71 | 18.26 | 27.82 | 61.09 |
| P99 TPOT(ms) | 17.93 | 31.75 | 13.04 | 32.51 | 17.88 | 30.80 | 59.88 | 18.52 | 28.24 | 62.40 |
| Median ITL (ms) | 17.53 | 30.93 | 12.97 | 32.46 | 17.75 | 30.14 | 58.82 | 18.22 | 27.79 | 60.78 |
| P99 ITL (ms) | 22.00 | 38.55 | 15.08 | 37.35 | 21.42 | 33.59 | 63.21 | 22.73 | 32.60 | 66.25 |
Total Throughput (tokens/sec)
Total Throughput reflects the overall decoding efficiency under sustained concurrency.
Observations:
- 8B models consistently deliver ~3,100–3,300 tokens/s
- GPT-OSS 20B (4-bit) achieves the highest throughput (~4,378 tokens/s) due to aggressive quantization and optimized architecture
- 32B models drop sharply to ~930–970 tokens/s
- GPT-OSS 120B further declines to ~1,780 tokens/s, despite quantization
✅ Key takeaway:
Pro 6000 performs best in the 8B–32B range, where compute utilization, memory bandwidth, and KV cache usage remain well balanced.
Request Throughput (req/s)
At 50 concurrent prompts:
- 8B models: ~4.4–4.6 req/s
- 14B models: ~2.6–2.9 req/s
- 32B models: ~1.3 req/s
- GPT-OSS 120B: ~2.5 req/s
Interestingly, GPT-OSS 120B maintains request throughput comparable to some 14B models.
Time to First Token (TTFT)
TTFT strongly affects perceived responsiveness.
- 8B models: 260–330 ms
- 14B models: 440–510 ms
- 32B models: ~1,000 ms
- GPT-OSS 120B: ~340 ms
Token Generation Latency (TPOT / ITL)
Per-token latency scales predictably with model size:
- 8B: ~13–18 ms/token
- 14B: ~28–31 ms/token
- 32B: ~58–61 ms/token
- GPT-OSS 120B: ~32 ms/token
Pro 6000 vs A100 vs H100: 300-Concurrent vLLM Stress Test
Under a 300-concurrent request stress test, the performance characteristics of Pro 6000, A100 80GB, and H100 diverge more clearly than in lower-concurrency benchmarks.
| GPU | DeepSeek-R1-Distill-Llama-8B | DeepSeek-R1-Distill-Qwen-14B | DeepSeek-R1-Distill-Qwen-32B | Price (USD) |
|---|---|---|---|---|
| A100-80GB | 6841.57tokens/s | 4187.33tokens/s | 720.75tokens/s | $9,500–$17,000 |
| H100 | 5933.63tokens/s | 4821.08tokens/s | 1481.62tokens/s | $25,000–$38,000 |
| PRO 6000 | 8990.22 tokens/s | 5160.25 tokens/s | 1654.67 tokens/s | $7,900–$10,900 |
Pro 6000 shows the strongest scaling behavior under high concurrency, delivering the highest total throughput across all tested models. It leads significantly on smaller and medium models, reaching 8,990 tokens/s on Llama-8B and 5,160 tokens/s on Qwen-14B, and also outperforms both A100 and H100 on Qwen-32B. This indicates strong scheduler efficiency and stable memory behavior in heavy vLLM batching scenarios.
H100 remains consistently strong but does not dominate at high concurrency in this test. While it maintains high throughput on all model sizes, its advantage over Pro 6000 diminishes under extreme request pressure, especially for 8B and 14B models. H100 still performs well on 32B workloads, but the gap is narrower than expected given its higher hardware cost.
A100 80GB shows the weakest scaling under 300-concurrent load, particularly for larger models. Although it performs reasonably on 14B, throughput drops sharply on both 8B and 32B models, suggesting earlier saturation under heavy batching and less favorable cost-performance at high concurrency.
From a cost-performance perspective, the results suggest:
- Pro 6000 offers the best value for high-concurrency inference, especially for API-style workloads with many simultaneous requests.
- H100 is better suited for performance-critical or large-model workloads, but its price premium is harder to justify purely on throughput at extreme concurrency.
- A100 80GB is less competitive in sustained high-concurrency vLLM inference, particularly when compared against newer or better-balanced alternatives.
Special Analysis: Why GPT-OSS-120B Can Run on a Single Pro 6000 (96 GB)
Although GPT-OSS-120B is nominally a 120B-parameter model, the version published on Hugging Face is quantized to 4-bit precision, which significantly reduces its actual memory footprint compared to standard 16-bit (FP16/BF16) models.
In practice, a 120B model at 16-bit precision would require well over 200 GB of GPU memory, making single-GPU deployment impossible. However, with 4-bit quantization, the effective model size is reduced to roughly one quarter of its FP16 equivalent, bringing the total GPU memory requirement down to approximately 60–65 GB, including model weights and runtime overhead.
This reduced memory footprint allows GPT-OSS-120B to fit comfortably within the 96 GB VRAM of a single Pro 6000, without relying on multi-GPU tensor parallelism or offloading strategies. As a result, single-GPU inference becomes feasible, simplifying deployment and reducing operational complexity.
It is important to note that this deployment feasibility is a direct result of aggressive quantization, rather than raw GPU memory capacity alone. Inference performance and output quality may differ from full-precision variants, but for many inference-focused and cost-sensitive workloads, the 4-bit GPT-OSS-120B model provides a practical and efficient trade-off.
Final Conclusions
Under vLLM inference workloads, Pro 6000 demonstrates stable, predictable performance with clear scaling characteristics:
- Excellent efficiency in 8B–40B inference
- At 300 concurrent requests, throughput scaling and batching efficiency matter more than peak hardware specs, and in this scenario, Pro 6000 demonstrates the most favorable balance between performance and cost.
- priced lower than the A100 80GB and H100, and offers superior performance compared to the A100 80GB and H100.
- The Pro6000 can perform VLLM inference on the GTP-OSS-120b model from Hugging Face.
For production inference—especially API, agent, or SaaS scenarios—model selection matters more than maximum parameter count, and Pro 6000 is best utilized in the mid-to-high-end model segment.
Only $479/mo, Rent Pro 6000 Server for AI Inference >
Attachment: Video Recording of Pro6000 vLLM Benchmark
Screenshot: Pro6000 vLLM Benchmark Results
Data Item Explanation in the Table
- Quantization: Indicates the numerical precision used for model weights, affecting memory usage and inference speed.
- Size (GB): Represents the approximate model memory footprint under the specified quantization, not necessarily peak GPU VRAM usage.
- Backend / Platform: Specifies the inference engine and runtime environment used for the benchmark.
- Tensor Parallel Size: Shows how many GPUs are used to run the model, with 1 meaning single-GPU inference.
- Max Model Length: Defines the maximum supported token length for input and output combined.
- Request Numbers: Indicates the total number of inference requests issued during the benchmark.
- Benchmark Duration (s): Measures the total time required to complete all benchmark requests.
- Total Input Tokens: The sum of all prompt tokens processed across requests.
- Total Generated Tokens: The total number of output tokens generated during the benchmark.
- Requests (req/s): Represents how many inference requests the system can handle per second.
- Input Throughput (tokens/s): Measures the rate at which input tokens are processed.
- Output Throughput (tokens/s): Measures the rate at which output tokens are generated.
- Total Throughput (tokens/s): Combines input and output token throughput to reflect overall inference efficiency.
- Median TTFT (ms): The median time from request submission to the first generated token.
- P99 TTFT (ms): The 99th-percentile time to first token, reflecting worst-case initial latency.
- Median TPOT (ms): The median time required to generate each output token after the first token.
- P99 TPOT (ms): The 99th-percentile per-token generation latency under load.
- Median ITL (ms): The median delay between consecutive output tokens during streaming generation.
- P99 ITL (ms): The 99th-percentile inter-token delay, indicating tail latency during output streaming.
Keywords:
Pro 6000 GPU benchmark, vLLM inference benchmark, LLM inference performance, GPU inference throughput, vLLM latency test, Pro 6000 LLM hosting, GPT-OSS-120B inference, DeepSeek R1 vLLM, Qwen vLLM benchmark, large language model inference GPU
Outline