


3×V100 vLLM Benchmark: Multi-GPU Inference Performance and Optimization
In the evolving landscape of LLM inference, balancing GPU utilization, model size, and inference speed is critical for efficiency. We present a comprehensive benchmark of large language model (LLM) inference performance on 3×V100 GPUs using vLLM, a high-throughput and memory-efficient inference engine. This report presents the vLLM benchmark results for 3×V100 GPUs, evaluating different models under 50 and 100 concurrent requests. By leveraging tensor-parallel and pipeline-parallel strategies, we tested various configurations to optimize performance while maintaining compatibility with models up to 14B parameters.
Test Overview
1. A Single V100 GPU Details:
- GPU: Nvidia V100
- Microarchitecture: Volta
- Compute capability: 7.0
- CUDA Cores: 5120
- Tensor Cores: 640
- Memory: 16GB HBM2
- FP32 performance: 14 TFLOPS
2. Test Project Code Source:
- We used this git project to build the environment(https://github.com/vllm-project/vllm)
3. The Following Models from Hugging Face were Tested:
- google/gemma-3-4b-it
- google/gemma-3-12b-it
- Qwen/Qwen2.5-7B-Instruct
- Qwen/Qwen2.5-14B-Instruct
- deepseek-ai/DeepSeek-R1-Distill-Llama-8B
- deepseek-ai/DeepSeek-R1-Distill-Qwen-14B
4. The Online Test Parameters are Preset as Follows:
- Input length: 100 tokens
- Output length: 600 tokens
- 50 / 100 concurrent requests
5. Optimizing vLLM Multi-GPU Inference
- Tensor Parallelism: Provides faster inference but requires even-numbered partitions (e.g., 2, 4, 8). Splits model layers across 2 GPUs (faster but memory-limited).
- Pipeline Parallelism: Allows running larger models by increasing the number of partitions, but at the cost of some efficiency. Distributes layers across 3 GPUs (slower but supports larger models).
- Float16 Precision: v100 only supports Float16 precision, but gemma3 uses bfloat16 by default. Manually adjusting the parameter to --dtype float16 allows v100 to infer the newer model to solve the compatibility issue.
6. Given these constraints, we adjusted parameters dynamically:
- Tensor Parallel (TP=2) was used wherever possible for faster performance.
- Pipeline Parallel (PP=3) was utilized for models too large to fit under TP=2.
3*V100 Benchmark for Scenario 1: 50 Concurrent Requests
| Models | gemma-3-4b-it | gemma-3-12b-it | Qwen2.5-7B-Instruct | Qwen2.5-14B-Instruct | DeepSeek-R1-Distill-Llama-8B | DeepSeek-R1-Distill-Qwen-14B |
|---|---|---|---|---|---|---|
| Quantization | 16 | 16 | 16 | 16 | 16 | 16 |
| Size(GB) | 8.1 | 23 | 15 | 28 | 15 | 28 |
| Backend/Platform | vLLM | vLLM | vLLM | vLLM | vLLM | vLLM |
| Tensor Parallelism | 2 | 1 | 2 | 1 | 2 | 1 |
| Pipeline Parallelism | 1 | 3 | 1 | 3 | 1 | 3 |
| Data Type | float16 | float16 | float16 | float16 | float16 | float16 |
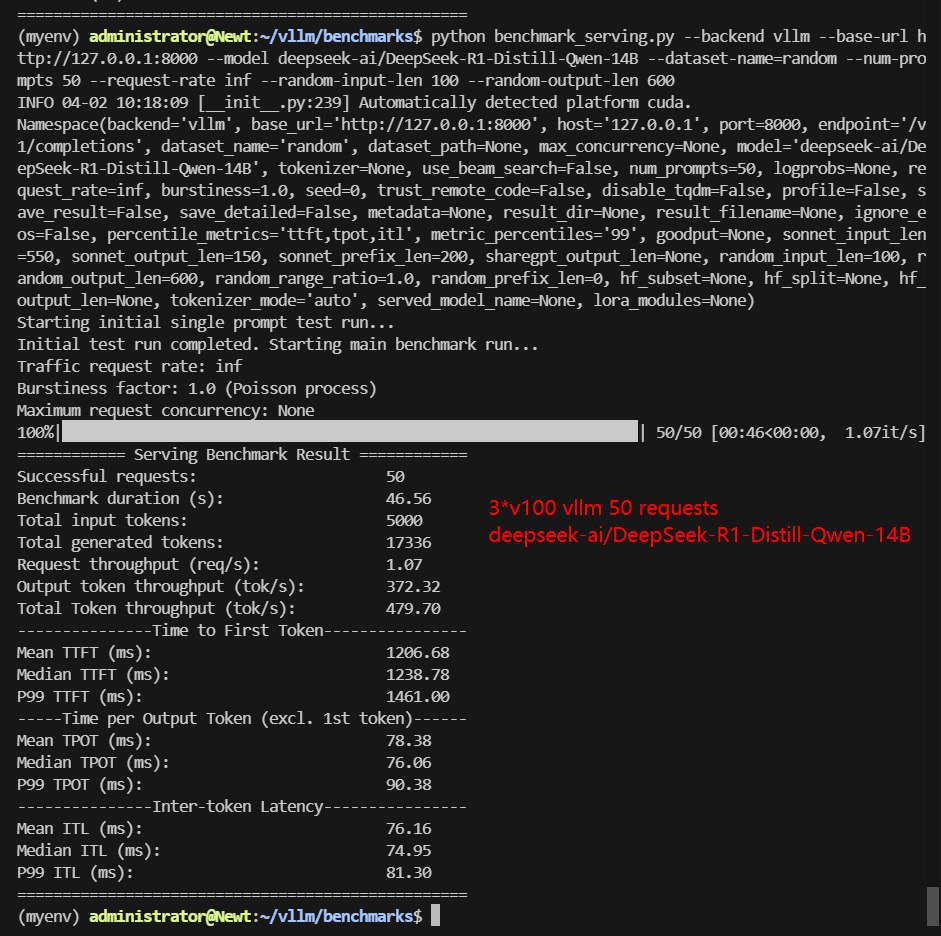
| Request Numbers | 50 | 50 | 50 | 50 | 50 | 50 |
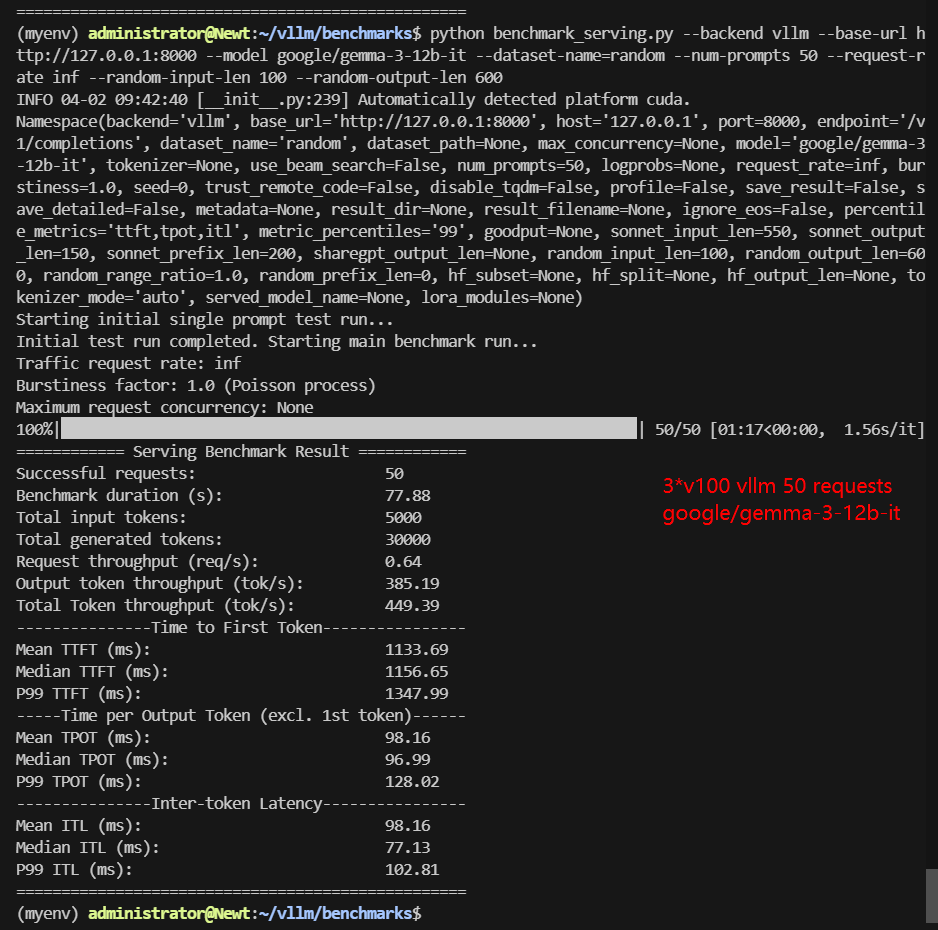
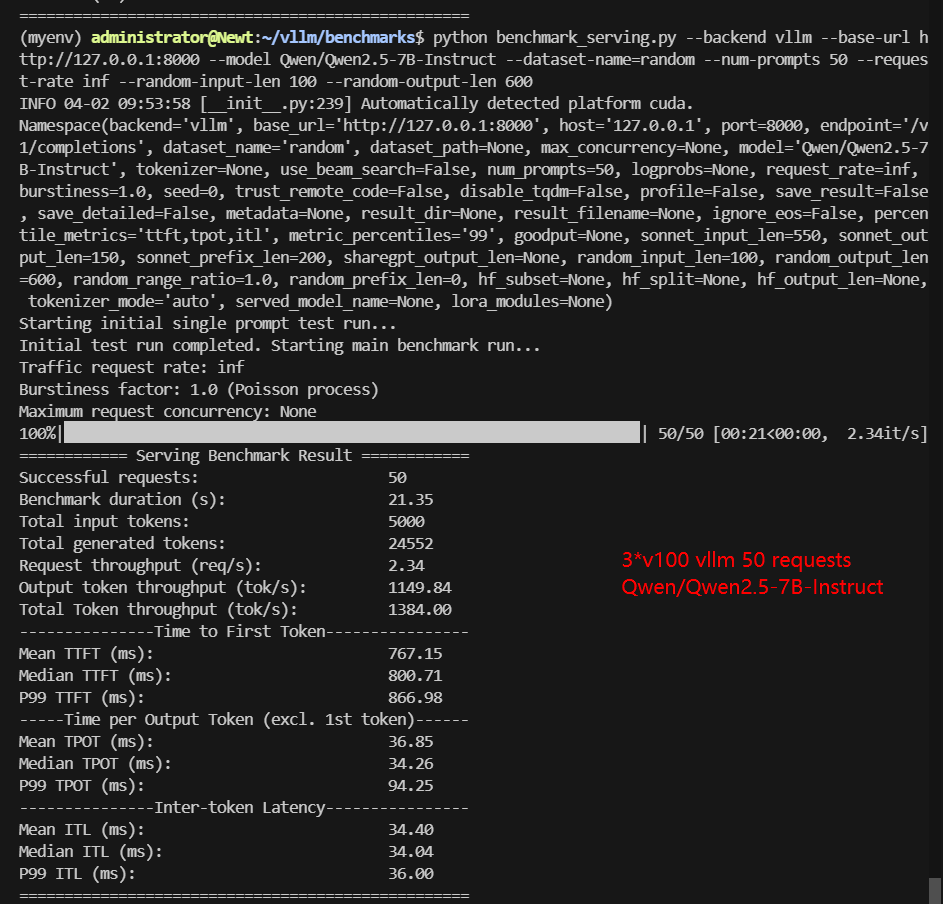
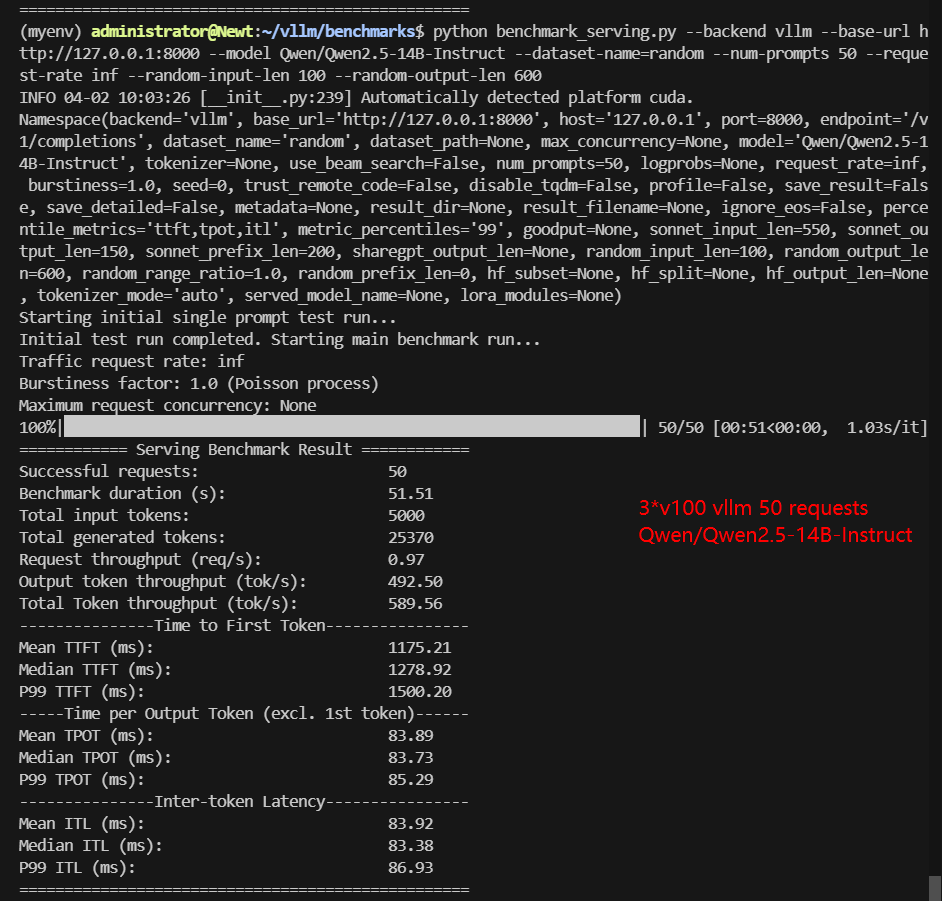
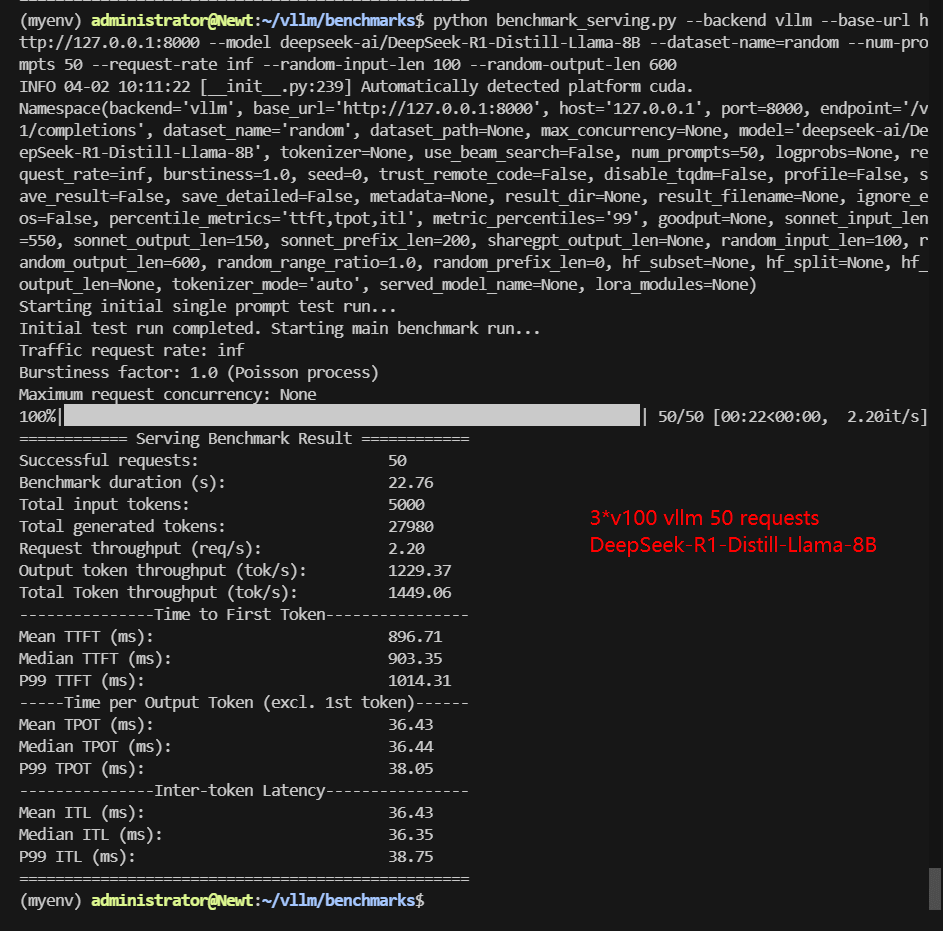
| Benchmark Duration(s) | 18.94 | 77.88 | 21.35 | 51.51 | 22.76 | 46.56 |
| Total Input Tokens | 5000 | 5000 | 5000 | 5000 | 5000 | 5000 |
| Total Generated Tokens | 30000 | 30000 | 24552 | 25370 | 27980 | 17336 |
| Request (req/s) | 2.64 | 0.64 | 2.34 | 0.97 | 2.2 | 1.07 |
| Input (tokens/s) | 263.96 | 64.2 | 234.16 | 97.06 | 219.69 | 107.38 |
| Output (tokens/s) | 1583.76 | 385.19 | 1149.84 | 492.50 | 1229.37 | 372.32 |
| Total Throughput (tokens/s) | 1847.72 | 449.39 | 1384.00 | 589.56 | 1449.06 | 479.70 |
| Median TTFT (ms) | 688.76 | 1156.65 | 800.71 | 1278.92 | 903.35 | 1238.78 |
| P99 TTFT (ms) | 713.25 | 1347.99 | 866.98 | 1500.20 | 1014.31 | 1461.00 |
| Median TPOT (ms) | 30.41 | 96.99 | 34.26 | 83.73 | 36.44 | 76.06 |
| P99 TPOT (ms) | 31.02 | 128.02 | 94.25 | 85.29 | 38.05 | 90.38 |
| Median Eval Rate (tokens/s) | 32.88 | 27.96 | 29.19 | 11.94 | 27.44 | 13.15 |
| P99 Eval Rate (tokens/s) | 32.24 | 7.37 | 10.61 | 11.72 | 26.28 | 11.06 |
✅ Performance Insights: 50 Concurrent Requests
- Gemma 3-12B (TP=1, PP=3): Achieved a total throughput of 449.39 tokens/s with a median TTFT of 1347.99ms.
- Qwen 7B (TP=2, PP=1): Reached 1,384 tokens/s, significantly outperforming Gemma 3-12B due to its lower parameter count.
- Qwen 14B (TP=1, PP=3): Handled 589.56 tokens/s, demonstrating how pipeline parallelism sacrifices speed for compatibility.
- Models using TP=2 (e.g., Gemma3-4B, Qwen2.5-7B) achieve higher throughput (1384-1847 tokens/s) and lower latency compared to PP=3 configurations.
3*V100 Benchmark for Scenario 2: 100 Concurrent Requests
| Models | gemma-3-4b-it | gemma-3-12b-it | Qwen2.5-7B-Instruct | Qwen2.5-14B-Instruct | DeepSeek-R1-Distill-Llama-8B | DeepSeek-R1-Distill-Qwen-14B |
|---|---|---|---|---|---|---|
| Quantization | 16 | 16 | 16 | 16 | 16 | 16 |
| Size(GB) | 8.1 | 23 | 15 | 28 | 15 | 28 |
| Backend/Platform | vLLM | vLLM | vLLM | vLLM | vLLM | vLLM |
| Tensor Parallelism | 2 | 1 | 2 | 1 | 2 | 1 |
| Pipeline Parallelism | 1 | 3 | 1 | 3 | 1 | 3 |
| Data Type | float16 | float16 | float16 | float16 | float16 | float16 |
| Request Numbers | 100 | 100 | 100 | 100 | 100 | 100 |
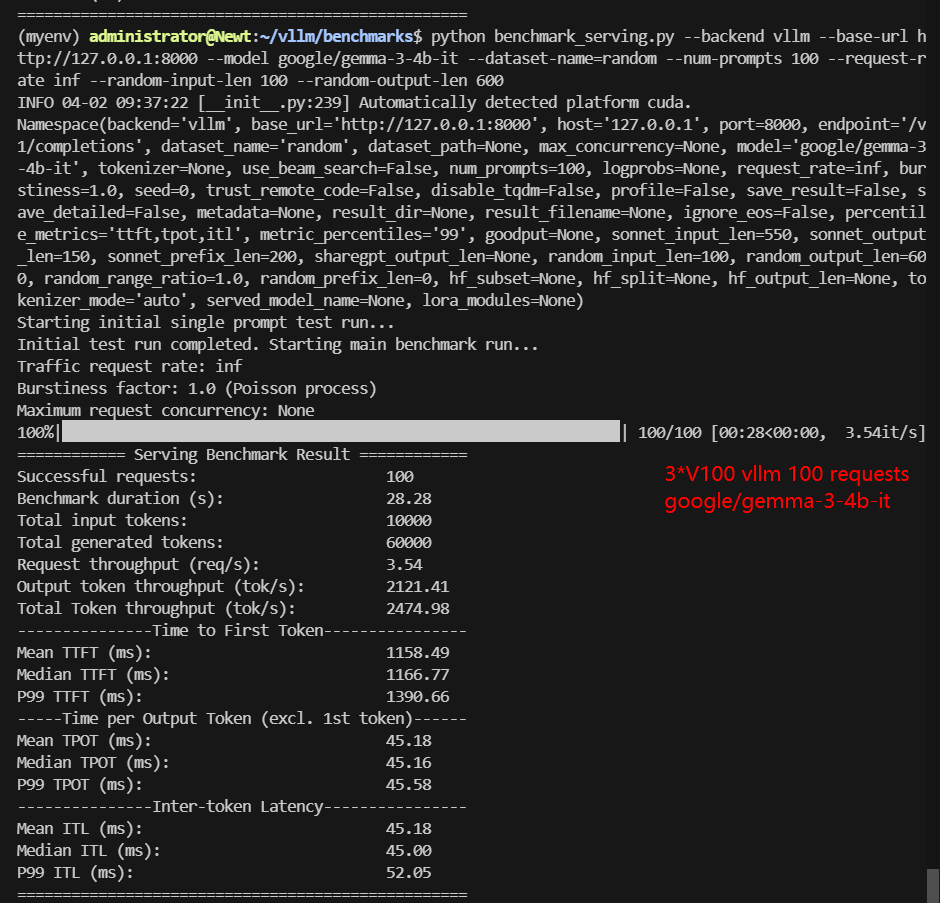
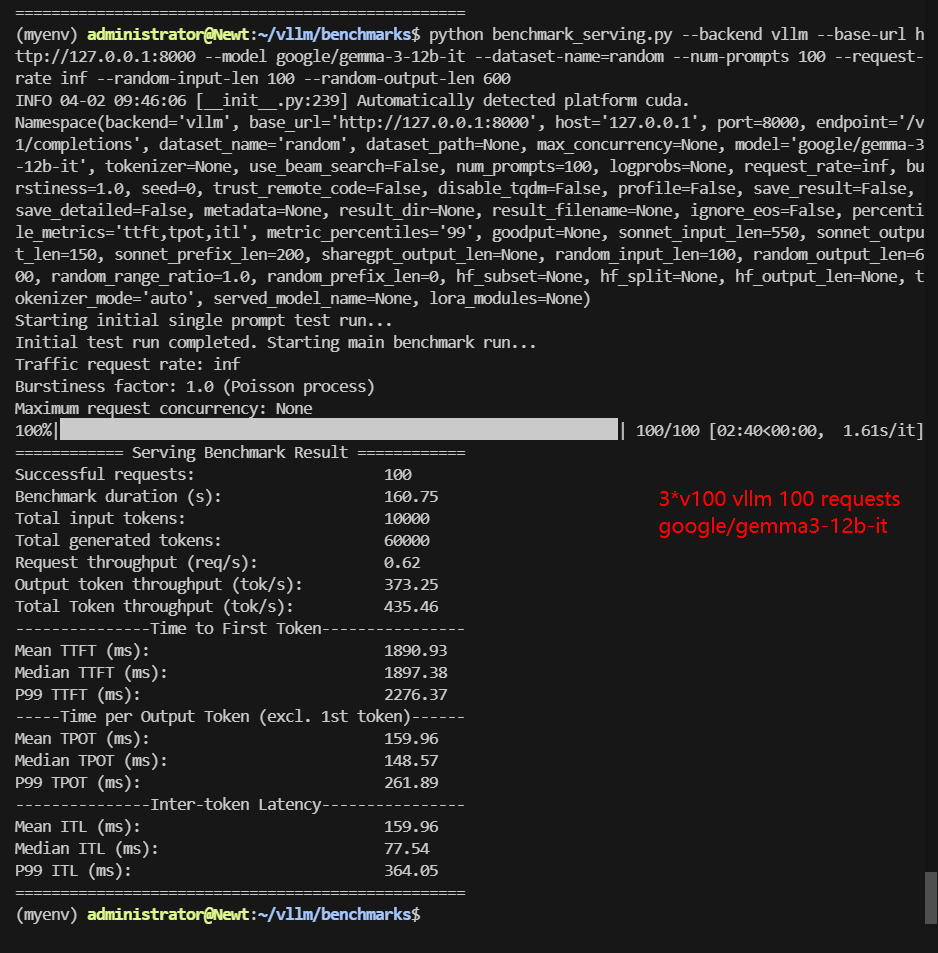
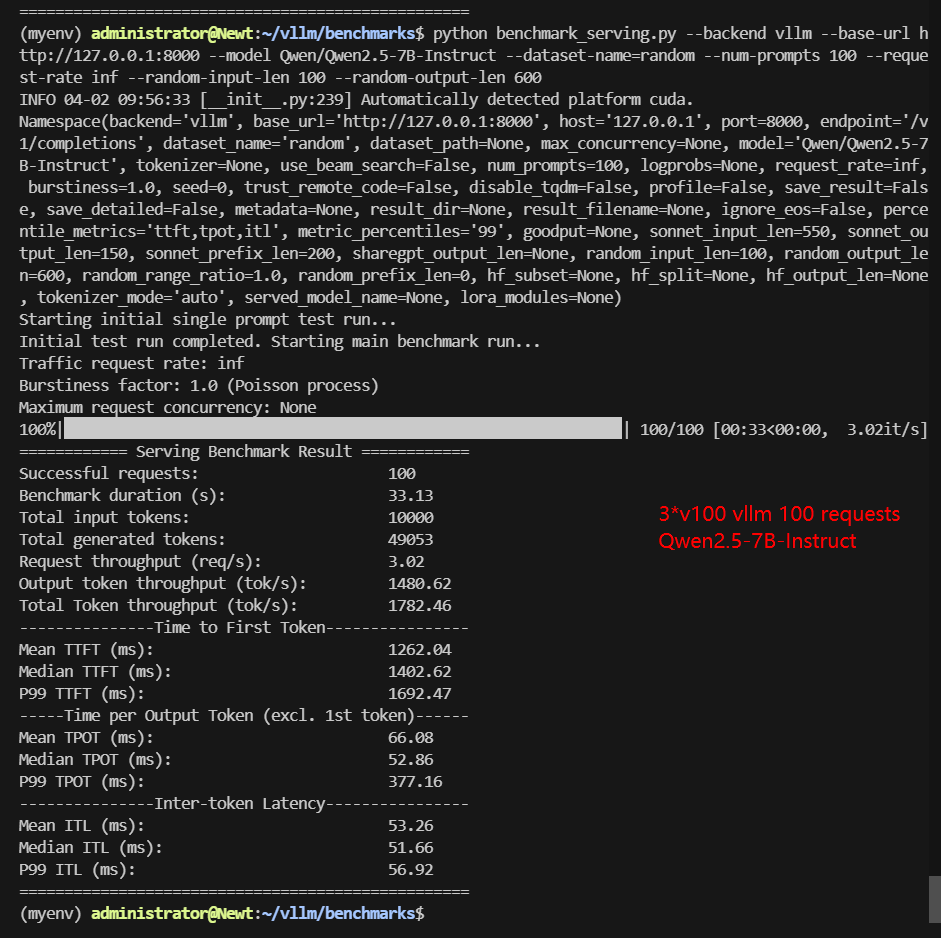
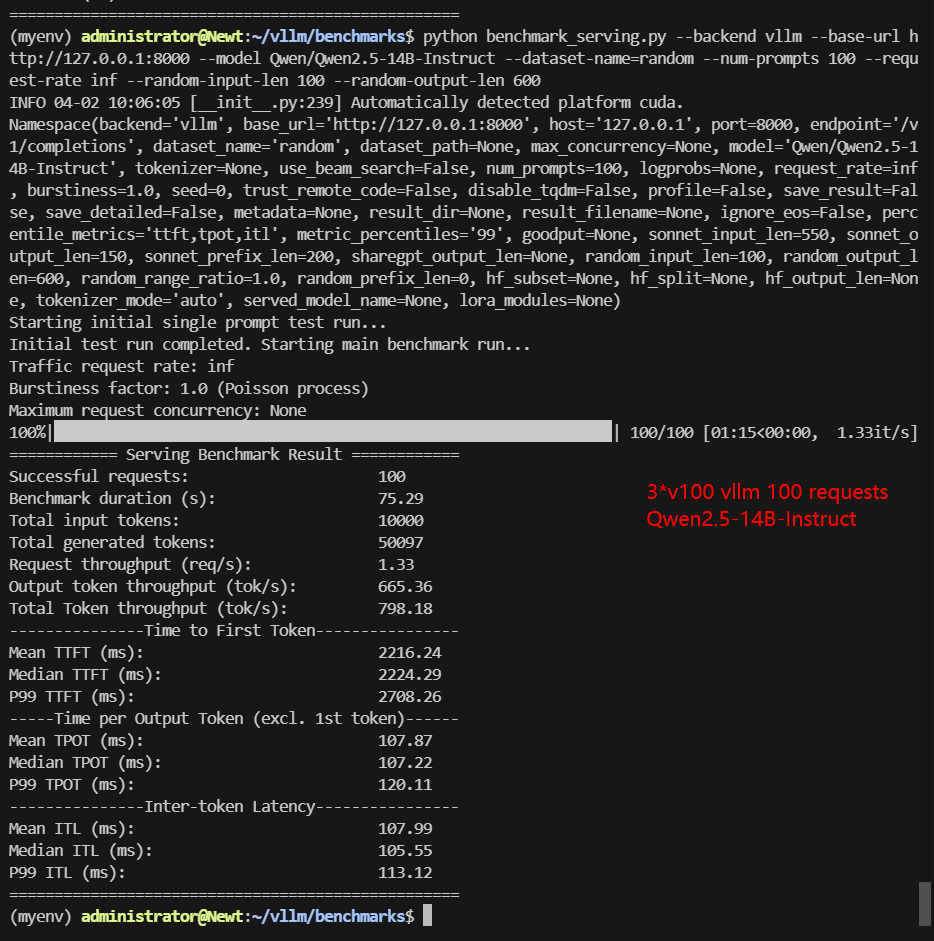
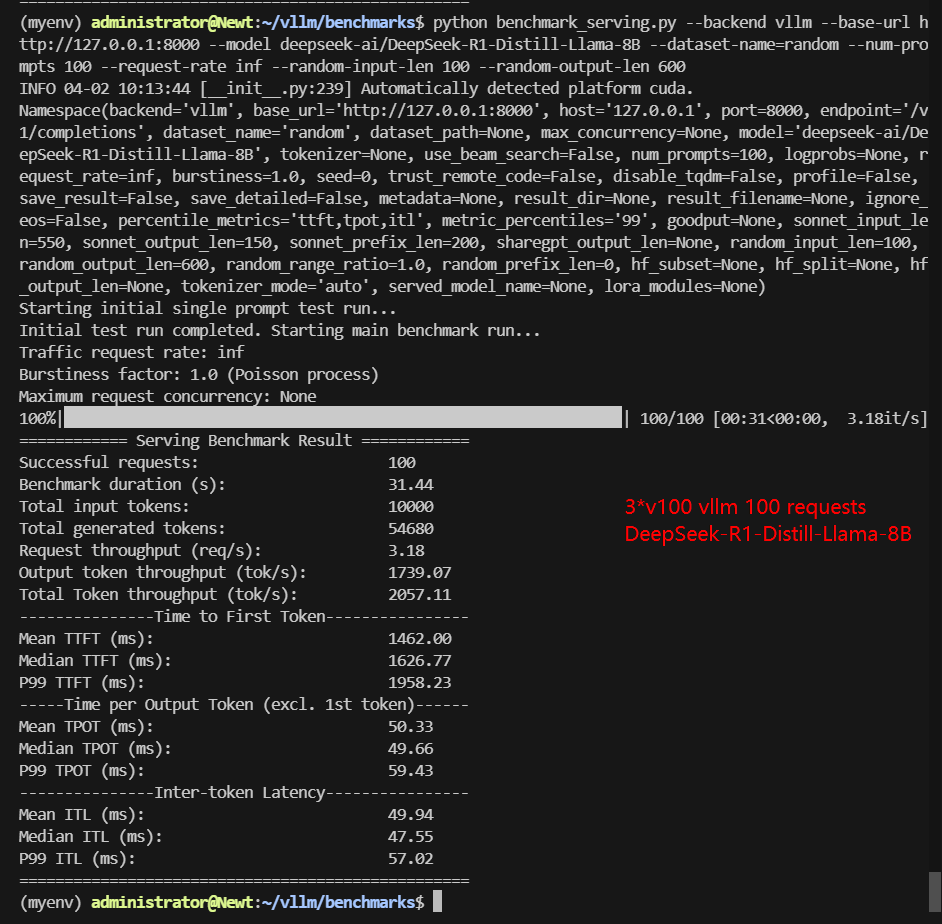
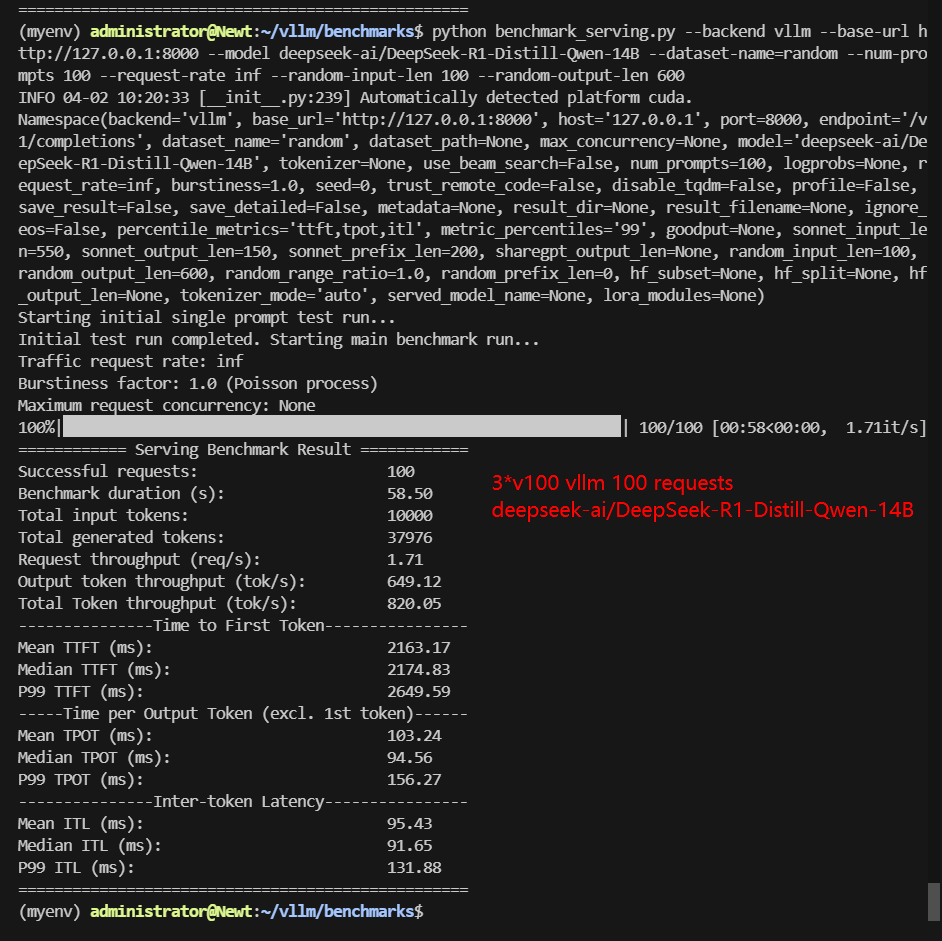
| Benchmark Duration(s) | 28.28 | 160.75 | 33.13 | 75.29 | 31.44 | 58.50 |
| Total Input Tokens | 10000 | 10000 | 10000 | 10000 | 10000 | 10000 |
| Total Generated Tokens | 60000 | 60000 | 49053 | 50097 | 54680 | 37976 |
| Request (req/s) | 3.54 | 0.62 | 3.02 | 1.33 | 3.18 | 1.71 |
| Input (tokens/s) | 353.57 | 62.21 | 301.84 | 132.82 | 318.04 | 170.93 |
| Output (tokens/s) | 2121.41 | 373.25 | 1480.62 | 665.36 | 1739.07 | 649.12 |
| Total Throughput (tokens/s) | 2474.98 | 435.46 | 1782.46 | 798.18 | 2057.11 | 820.05 |
| Median TTFT (ms) | 1166.77 | 1897.38 | 1402.62 | 2224.29 | 1426.77 | 2174.83 |
| P99 TTFT (ms) | 1390.66 | 2276.37 | 1692.47 | 2708.26 | 1958.23 | 2649.59 |
| Median TPOT (ms) | 45.16 | 148.57 | 52.86 | 107.22 | 49.66 | 94.56 |
| P99 TPOT (ms) | 45.58 | 261.89 | 377.16 | 120.11 | 59.43 | 156.27 |
| Median Eval Rate (tokens/s) | 22.14 | 6.73 | 18.92 | 9.33 | 20.13 | 10.57 |
| P99 Eval Rate (tokens/s) | 22.04 | 3.82 | 2.65 | 8.33 | 16.83 | 6.40 |
✅ Performance Insights: 100 Concurrent Requests
- As concurrency increased, median TTFT rose, and overall throughput declined due to increased queuing delays.
- Gemma 3-12B (TP=2, PP=1) dropped to 435.46 tokens/s, highlighting that this newer model is also more GPU demanding.
- Llama-8B (TP=1, PP=3) maintained 2057 tokens/s, showing pipeline parallelism can sustain performance across higher concurrency.
Key Findings of 3*v100 Benchmark Results
1. Tensor-parallel (TP) outperforms pipeline-parallel (PP)
2. Pipeline-parallel enables larger models
3. Gemma3-4B leads in efficiency
Optimization Insights and Best Practices for vLLM Performance
✅ Use Tensor Parallelism (TP=2) Whenever Possible:
✅ Make sure the tensor parallel size is an even number:
✅ Set --dtype float16 for newer Models:
✅ Balance Concurrency and Latency:
Get Started with 3*V100 GPU Server Hosting
Interested in optimizing your vLLM deployment? Check out GPU server rental services or explore alternative GPUs for high-end AI inference.
Multi-GPU Dedicated Server - 3xV100
- 256GB RAM
- Dual 18-Core E5-2697v4
- 240GB SSD + 2TB NVMe + 8TB SATA
- 1Gbps
- OS: Windows / Linux
- GPU: 3 x Nvidia V100
- Microarchitecture: Volta
- CUDA Cores: 5,120
- Tensor Cores: 640
- GPU Memory: 16GB HBM2
- FP32 Performance: 14 TFLOPS
- Expertise in deep learning and AI workloads with more tensor cores
Multi-GPU Dedicated Server- 2xRTX 4090
- 256GB RAM
- Dual 18-Core E5-2697v4
- 240GB SSD + 2TB NVMe + 8TB SATA
- 1Gbps
- OS: Windows / Linux
- GPU: 2 x GeForce RTX 4090
- Microarchitecture: Ada Lovelace
- CUDA Cores: 16,384
- Tensor Cores: 512
- GPU Memory: 24 GB GDDR6X
- FP32 Performance: 82.6 TFLOPS
Enterprise GPU Dedicated Server - A100
- 256GB RAM
- Dual 18-Core E5-2697v4
- 240GB SSD + 2TB NVMe + 8TB SATA
- 100Mbps-1Gbps
- OS: Windows / Linux
- GPU: Nvidia A100
- Microarchitecture: Ampere
- CUDA Cores: 6912
- Tensor Cores: 432
- GPU Memory: 40GB HBM2
- FP32 Performance: 19.5 TFLOPS
- Good alternativeto A800, H100, H800, L40. Support FP64 precision computation, large-scale inference/AI training/ML.etc
Multi-GPU Dedicated Server - 2xA100
- 256GB RAM
- Dual 18-Core E5-2697v4
- 240GB SSD + 2TB NVMe + 8TB SATA
- 1Gbps
- OS: Windows / Linux
- GPU: Nvidia A100
- Microarchitecture: Ampere
- CUDA Cores: 6912
- Tensor Cores: 432
- GPU Memory: 40GB HBM2
- FP32 Performance: 19.5 TFLOPS
- Free NVLink Included
- A Powerful Dual-GPU Solution for Demanding AI Workloads, Large-Scale Inference, ML Training.etc. A cost-effective alternative to A100 80GB and H100, delivering exceptional performance at a competitive price.
Conclusion: 3*V100 is a Cheap Choice for LLMs Under 14B on Hugging Face
This 3×V100 vLLM benchmark demonstrates that carefully tuning tensor-parallel and pipeline-parallel parameters can maximize model performance while extending GPU capability to larger models. By following these best practices, researchers and developers can optimize LLM inference on budget-friendly multi-GPU setups.
Attachment: Video Recording of 3*V100 vLLM Benchmark

Data Item Explanation in the Table:
- Quantization: The number of quantization bits. This test uses 16 bits, a full-blooded model.
- Size(GB): Model size in GB.
- Backend: The inference backend used. In this test, vLLM is used.
- --tensor-parallel-size: Specifies the number of GPUs used to split the model's tensors horizontally (layer-wise), reducing computation time but requiring high GPU memory bandwidth (e.g., --tensor-parallel-size 2 splits workloads across 2 GPUs).
- --pipeline-parallel-size: Distributes model layers vertically (stage-wise) across GPUs, enabling larger models to run with higher memory efficiency but introducing communication overhead (e.g., --pipeline-parallel-size 3 divides layers sequentially across 3 GPUs).
- --dtype: Defines the numerical precision (e.g., --dtype float16 for FP16) to balance memory usage and computational accuracy during inference. Lower precision (e.g., FP16) speeds up inference but may slightly reduce output quality.
- Successful Requests: The number of requests processed.
- Benchmark duration(s): The total time to complete all requests.
- Total input tokens: The total number of input tokens across all requests.
- Total generated tokens: The total number of output tokens generated across all requests.
- Request (req/s): The number of requests processed per second.
- Input (tokens/s): The number of input tokens processed per second.
- Output (tokens/s): The number of output tokens generated per second.
- Total Throughput (tokens/s): The total number of tokens processed per second (input + output).
- Median TTFT(ms): The time from when the request is made to when the first token is received, in milliseconds. A lower TTFT means that the user is able to get a response faster.
- P99 TTFT (ms): The 99th percentile Time to First Token, representing the worst-case latency for 99% of requests—lower is better to ensure consistent performance.
- Median TPOT(ms): The time required to generate each output token, in milliseconds. A lower TPOT indicates that the system is able to generate a complete response faster.
- P99 TPOT (ms): The 99th percentile Time Per Output Token, showing the worst-case delay in token generation—lower is better to minimize response variability.
- Median Eval Rate(tokens/s): The number of tokens evaluated per second per user. A high evaluation rate indicates that the system is able to serve each user efficiently.
- P99 Eval Rate(tokens/s): The number of tokens evaluated per second by the 99th percentile user represents the worst user experience.
3×V100 vLLM benchmark, vLLM multi-GPU inference, tensor-parallel, pipeline-parallel, vLLM performance optimization, Gemma 3-12B inference, Qwen 7B benchmark, Llama-8B performance, LLM inference tuning, float16 precision, vLLM concurrency tuning