

How to Do a GPU Stress Test Using GPU Burn
What is GPU Burn?
GPU Burn is a lightweight, command-line based utility designed to push your GPU to its maximum computational capacity. It's particularly effective at generating intense workloads that test stability, thermal management, and error detection capabilities. It's often used in professional and server environments for hardware validation.
gpu_burn is a CUDA-based stress test tool that pushes your GPU(s) to maximum load using matrix multiplication kernels. It’s similar to CPU tools like stress-ng or Prime95, but designed for NVIDIA GPUs. It will quickly heat up the card(s) and detect instability (ECC/memory errors, crashes, thermal throttling).
Before You Begin: Precautions
- Thermal Awareness: Stress testing generates immense heat. Ensure your system has adequate cooling. Monitor temperatures closely to prevent potential hardware damage from overheating.
- Close Applications: Shut down all non-essential applications to free up system resources and ensure an uncontaminated test.
- Know Your Hardware: Be aware of your GPU's specified maximum operating temperature (TJ Max). Modern GPUs typically have a throttle point around 105°C.
- Backup: While not directly related to GPU stress testing, it's always a good practice to ensure your important data is backed up.
Step 1. Install Prerequisites
Make sure you have:
- NVIDIA GPU
- NVIDIA driver installed
- CUDA toolkit installed (so headers like
cublas_v2.hare available)
On Ubuntu/Debian:
sudo apt update
sudo apt install git build-essential nvidia-cuda-toolkit
Step 2. Download gpu_burn
Clone the repo:
git clone https://github.com/wilicc/gpu-burn.git
cd gpu-burn
Step 3. Compile
Build with make:
makeThis generates the binary gpu_burn.
⚠️ If you see an error like:
fatal error: cublas_v2.h: No such file or directoryThat means CUDA headers are missing. Fix by installing CUDA dev packages:
sudo apt install nvidia-cuda-devOr, if you installed CUDA manually, set the path before compiling:
make CUDA_PATH=/usr/local/cudaStep 4. Run Stress Test
GPU Burn Cli Help
Usage: gpu_burn [OPTIONS] [TIME]

-m X   Use X MB of memory
-m N%  Use N% of the available GPU memory
-d     Use doubles
-tc    Try to use Tensor cores (if available)
-l     List all GPUs in the system
-i N   Execute only on GPU N
-h     Show this help message
Run a full-load GPU stress test for 1 hour (example):
./gpu_burn -d 3600Run a 3-minute stress test with Tensor cores enabled and GPU memory load capped at 90%.
./gpu_burn -tc -m 90% 180- The number is the duration in seconds.
- If you have multiple GPUs, it will stress all of them by default.
- Run longer (e.g., 600 = 10 minutes, 3600 = 1 hour) for stability checks.
Step 5. Monitor GPU While Testing
Open a second terminal and run:
watch -n 1 nvidia-smiThis shows:
- GPU utilization (should be 99-100%)
- Temperature (watch for overheating; most GPUs throttle >85°C)
- Power usage
- Fan speed
Step 6. Stop the Test
Press Ctrl+C anytime to stop.
📊 Test Results
If the GPU is stable, the program runs without errors until the timer ends.
If unstable, you may see:
- CUDA errors
- ECC errors (if GPU supports ECC memory)
- Kernel crash (GPU reset or driver crash)
Output sample:
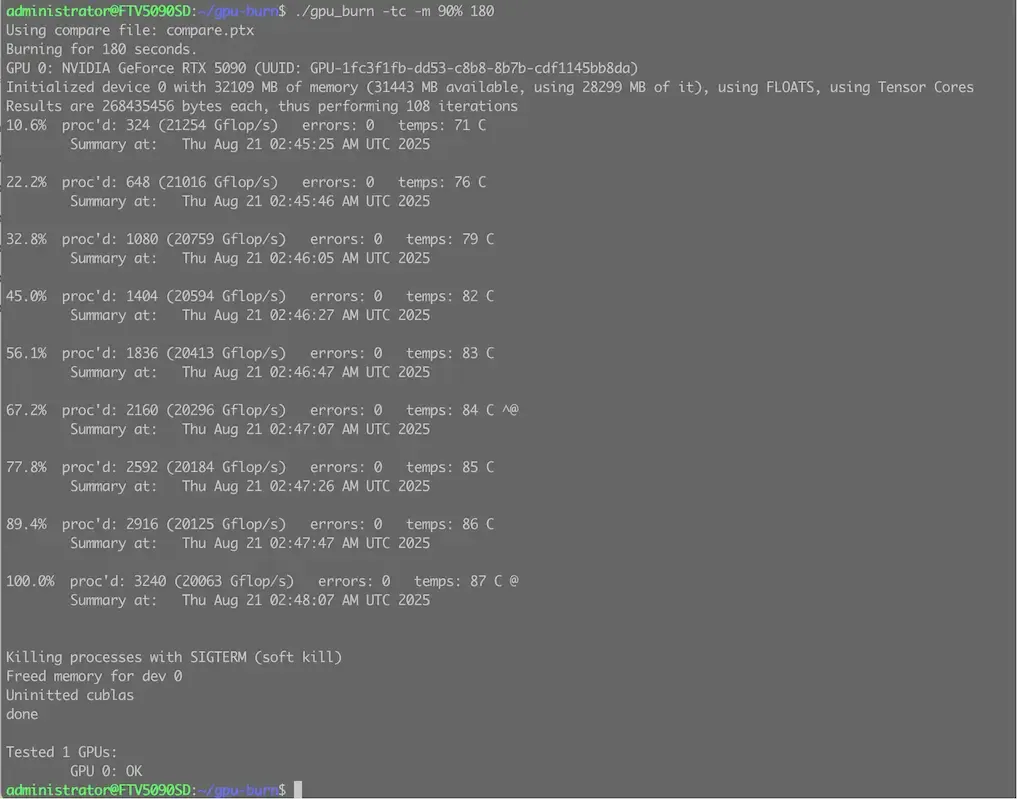
Reading the Output:
GPU Burn provides a concise real-time output for each GPU. A typical, healthy output looks like this:
89.4% proc'd: 2916 (2015 Gflop/s) errors: 0 temps: 86 C89.4%: The average GPU load during the test. A value consistently near 100% indicates the GPU is being fully utilized.2916: The number of work processes handled by the GPU.2015 Gflop/s: The actual floating-point compute performance achieved. You can compare this to your GPU's theoretical maximum to gauge performance.errors: 0: 🚨 This is the most critical field. It should always read 0. Any number greater than zero indicates computational errors, a sure sign of instability. This could be due to an overclock, faulty hardware, or insufficient power 5.86 C: The current core temperature.
⚠️ Tips
- Do not run for hours unattended, as it heats GPUs heavily.
- Useful for checking cooling systems, overclocking stability, or GPU health in rental servers.