


Video: RTX4090 vLLM Benchmark Offline Test Hugging Face LLMs

RTX4090 vLLM Benchmark: Best GPU for LLMs Below 8B on Hugging Face
As large language models (LLMs) continue to evolve, efficient GPU inference becomes a critical concern. Many AI developers and researchers are looking for an optimal balance between performance, cost, and efficiency when running LLMs on consumer-grade GPUs like the Nvidia RTX 4090.
In this benchmark, we tested various Hugging Face models on an RTX 4090 using vLLM, a high-performance inference framework designed to optimize LLM serving. The results provide valuable insights into vLLM performance, 4090 LLM inference speed, and the best LLM models for consumer GPUs.
Test Overview
1. RTX4090 GPU Details:
- GPU: NVIDIA RTX 4090
- Microarchitecture: Ada Lovelace
- Compute capability: 8.9
- CUDA Cores: 16384
- Tensor Cores: 512
- Memory: 24GB GDDR6X
- FP32 performance: 82.6 TFLOPS
2. Test Project Code Source:
- We used this git project to build the environment(https://github.com/vllm-project/vllm)
3. The Following Models from Hugging Face were Tested:
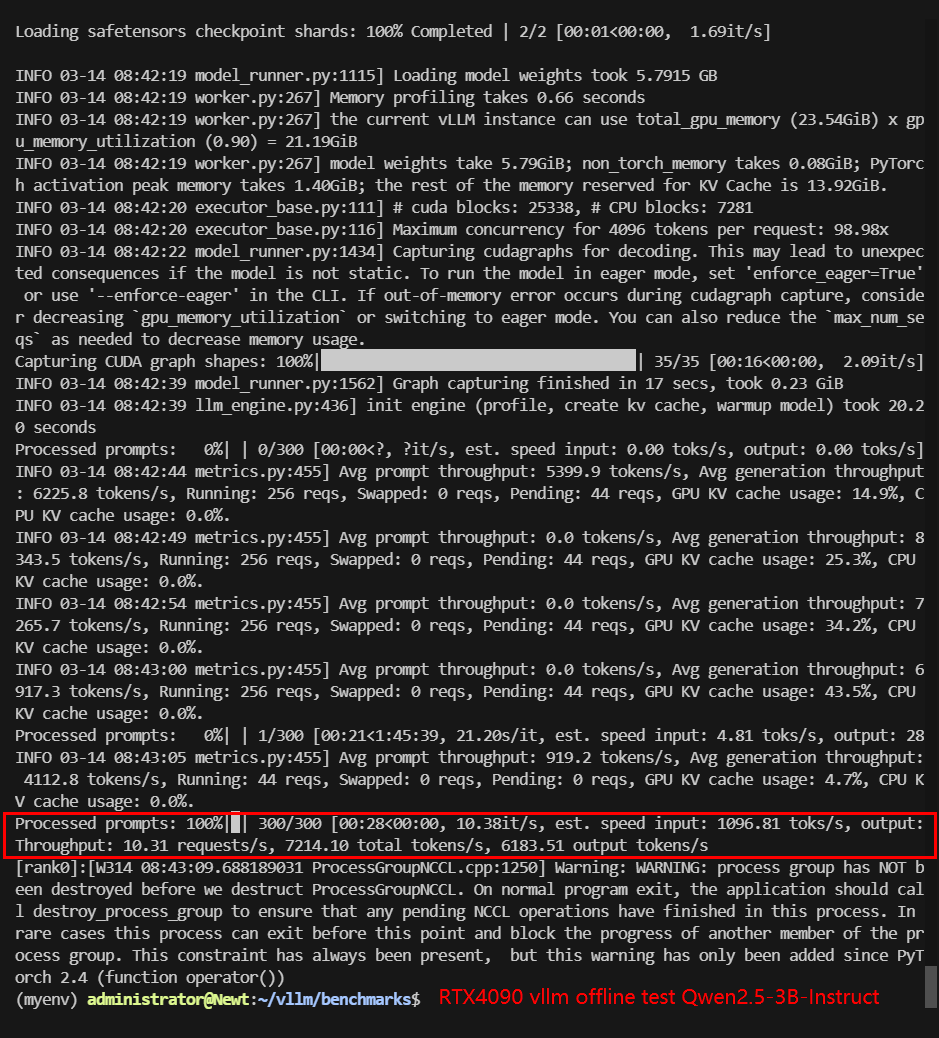
- Qwen/Qwen2.5-3B-Instruct
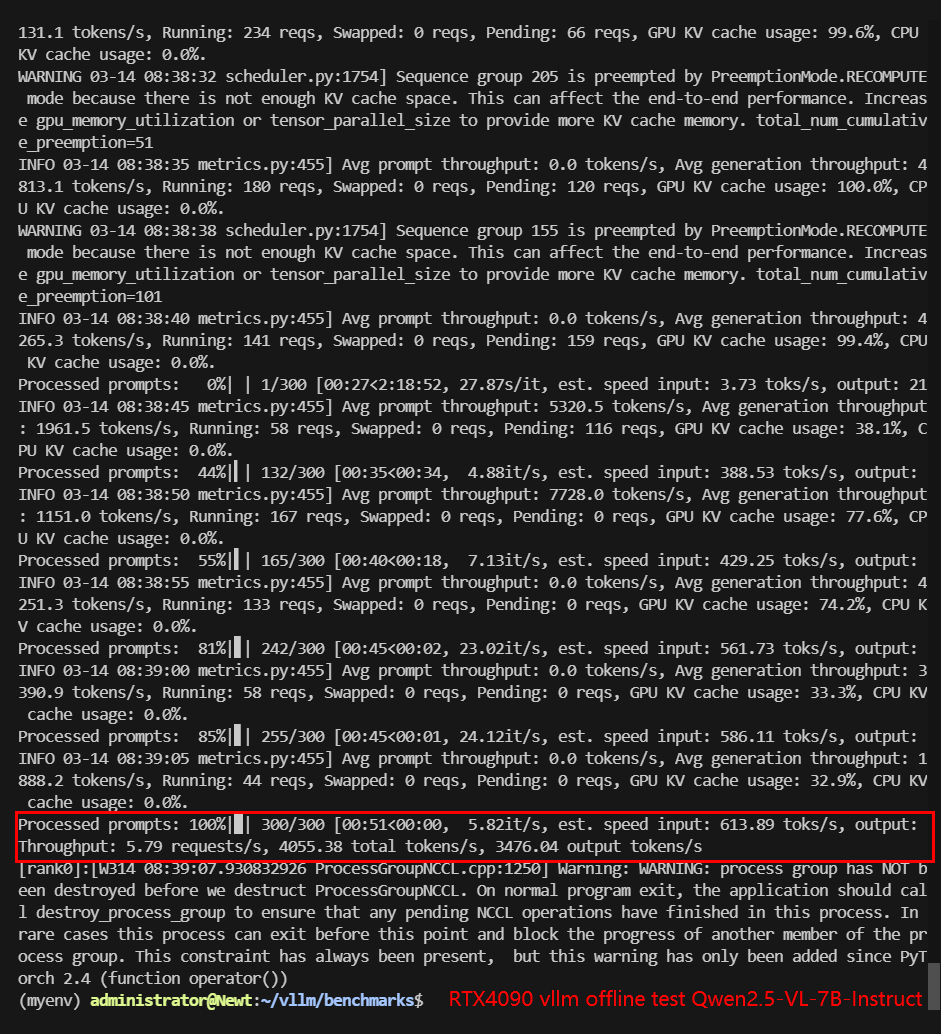
- Qwen/Qwen2.5-VL-7B-Instruct
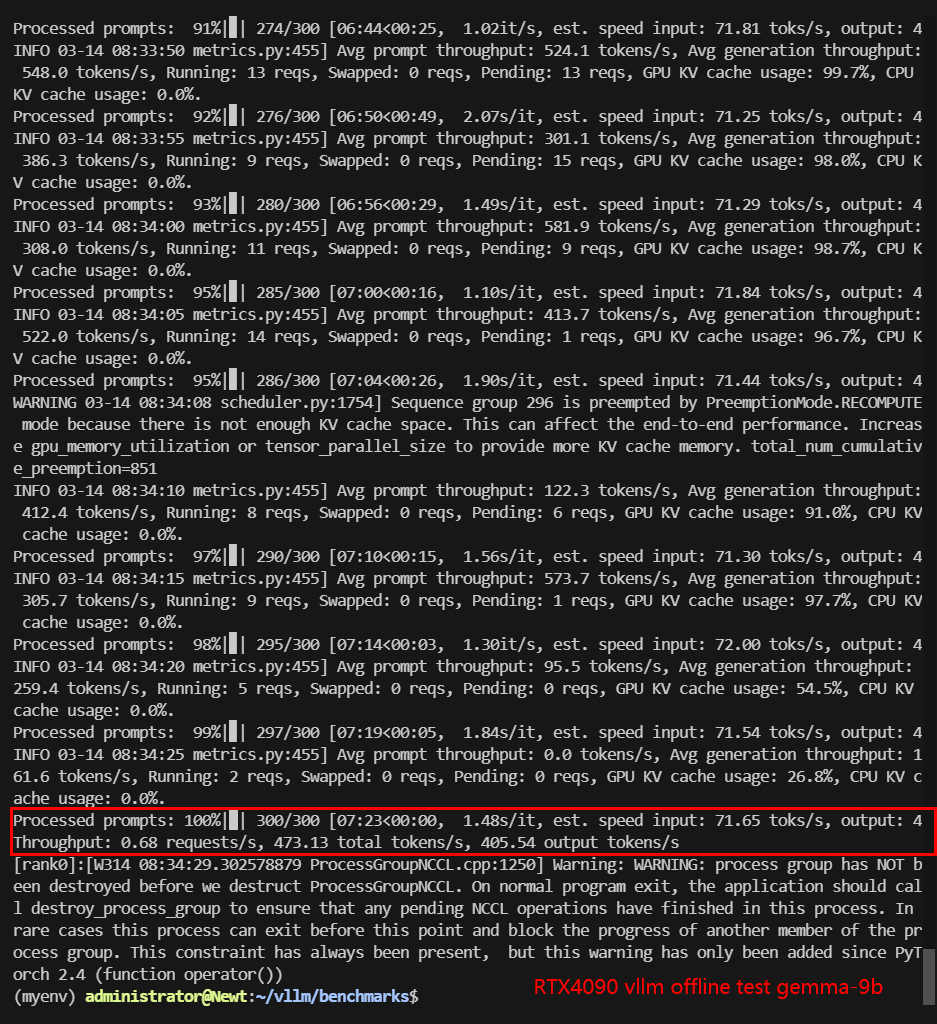
- google/gemma-2-9b-it
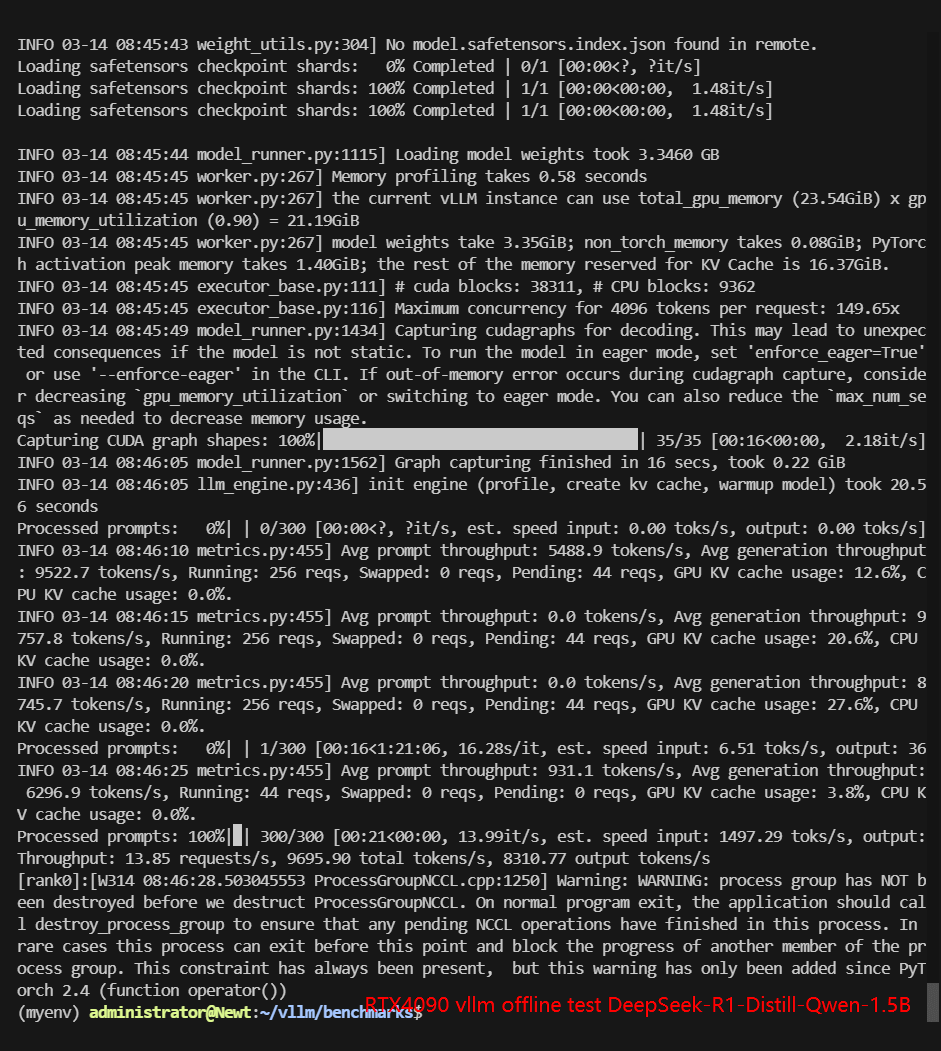
- deepseek-ai/DeepSeek-R1-Distill-Qwen-1.5B
- deepseek-ai/DeepSeek-R1-Distill-Llama-8B
- deepseek-ai/DeepSeek-R1-Distill-Qwen-7B
4. The Test Parameters are Preset as Follows:
- Input length: 100 tokens
- Output length: 600 tokens
- Request Numbers: 300
5. The Test is Divided into Two Modes:
- Offline testing: Usually all requests are sent at once, and the system needs to process a large number of requests at the same time, which may cause resource competition and memory pressure. More suitable for evaluating the maximum throughput and extreme performance of the system.
- Online testing: To simulate real client requests, Requests are sent gradually, so the system can allocate resources more flexibly and reduce resource contention. More suitable for evaluating the performance of the system in an actual production environment.
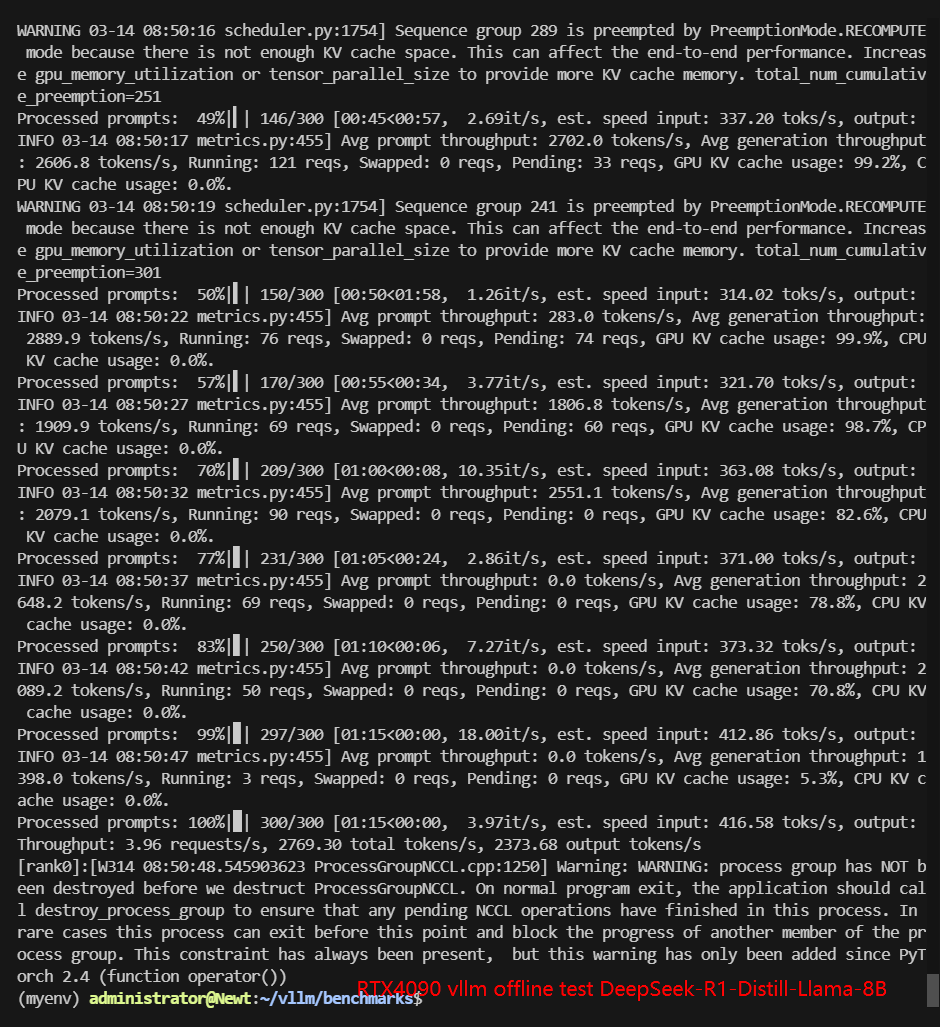
RTX4090 Offline Benchmark Results Display
| Models | Qwen2.5-3B-Instruct | Qwen2.5-VL-7B-Instruct | gemma-2-9b-it | DeepSeek-R1-Distill-Qwen-1.5B | DeepSeek-R1-Distill-Llama-8B | DeepSeek-R1-Distill-Qwen-7B |
|---|---|---|---|---|---|---|
| Quantization | 16 | 16 | 16 | 16 | 16 | 16 |
| Size(GB) | 6.2GB | 16.6GB | 18.5GB | 3.6GB | 16.1GB | 15.2GB |
| Backend/Platform | vLLM | vLLM | vLLM | vLLM | vLLM | vLLM |
| CPU Rate | 1.4% | 1.4% | 1.4% | 1.4% | 1.4% | 1.4% |
| RAM Rate | 3.5% | 3.9% | 3.9% | 4.5% | 3.3% | 4.6% |
| GPU vRAM Rate | 89% | 84% | 84% | 90% | 91% | 91% |
| GPU UTL | 64% | 94% | 94% | 64% | 81-89% | 85% |
| Request (req/s) | 10.31 | 5.79 | 0.68 | 13.85 | 3.96 | 5.96 |
| Total Duration | 28s | 51s | 7min23s | 21s | 1min15s | 50s |
| Input (tokens/s) | 1030.59 | 579.34 | 67.59 | 1385.13 | 395.62 | 596.11 |
| Output (tokens/s) | 6183.51 | 3476.04 | 405.54 | 8310.77 | 2373.68 | 3576.69 |
| Total Throughput (tokens/s) | 7214.10 | 4055.38 | 473.13 | 9695.90 | 2769.30 | 4172.80 |
✅ Key Takeaways:
- 4090 is best suited for LLMs under 8B. Performance degrades significantly for larger models like Gemma-9B, likely due to VRAM limitations.
- Qwen2.5-3B and DeepSeek-R1-Distill-1.5B achieved the highest throughput.
- DeepSeek-R1-Distill-Qwen-7B and Llama-8B also performed well, but slower than 3B models.
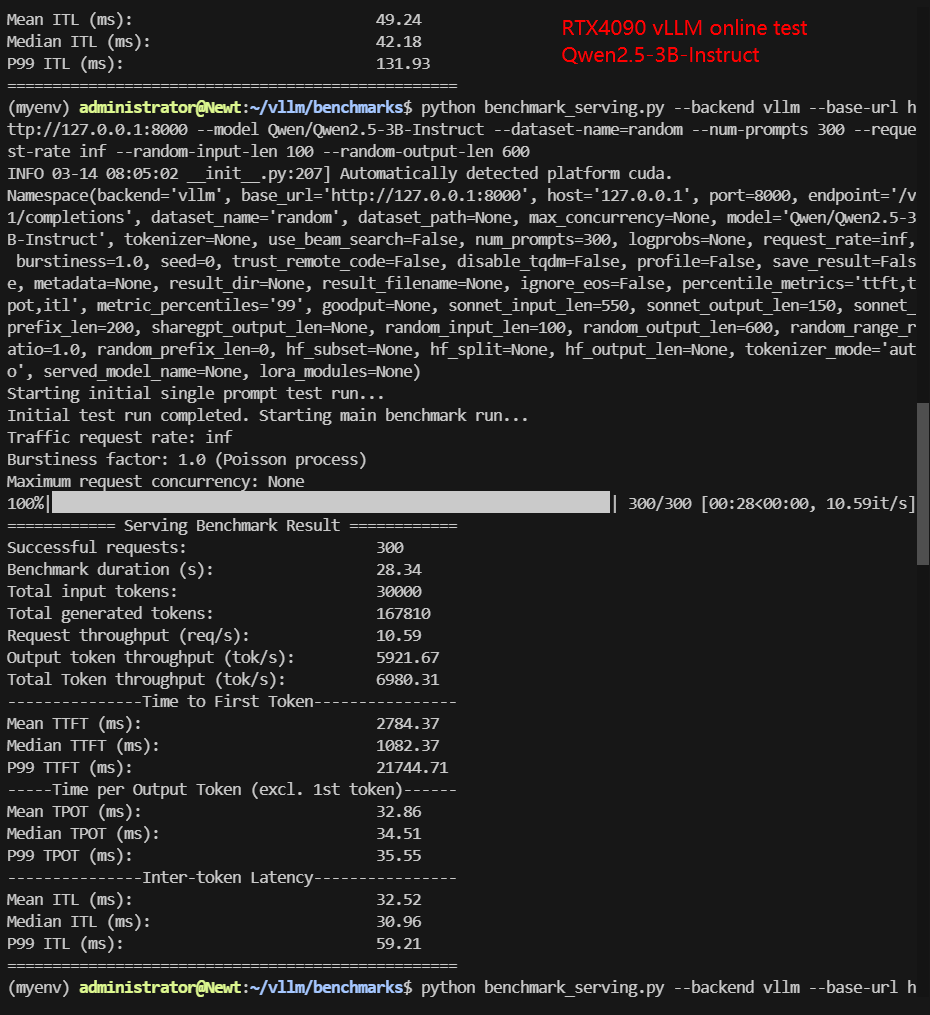
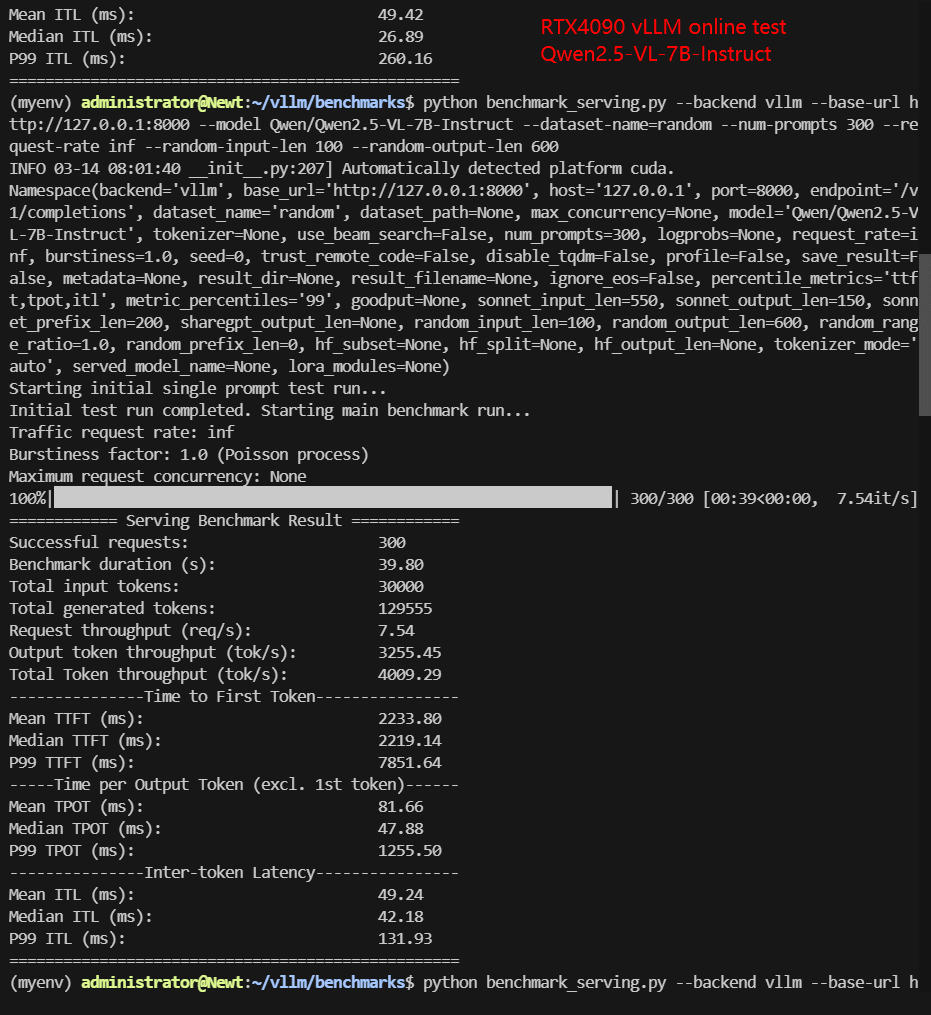
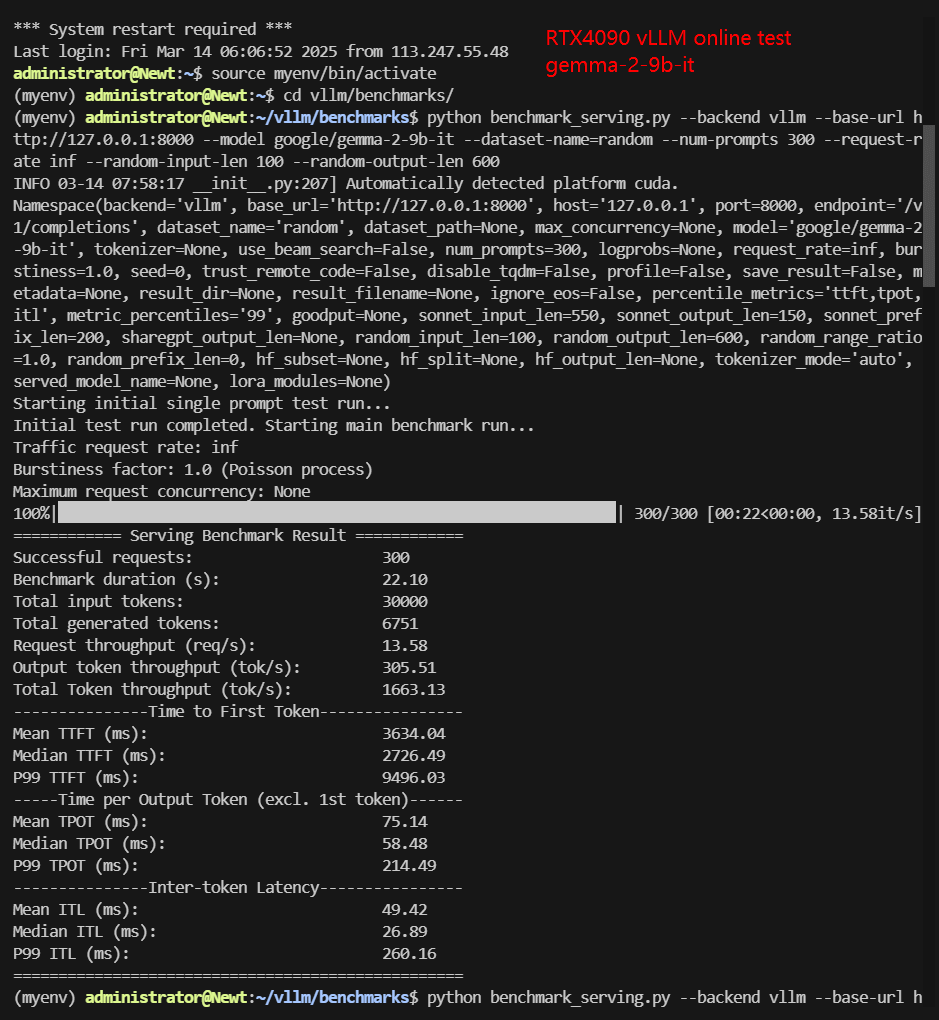
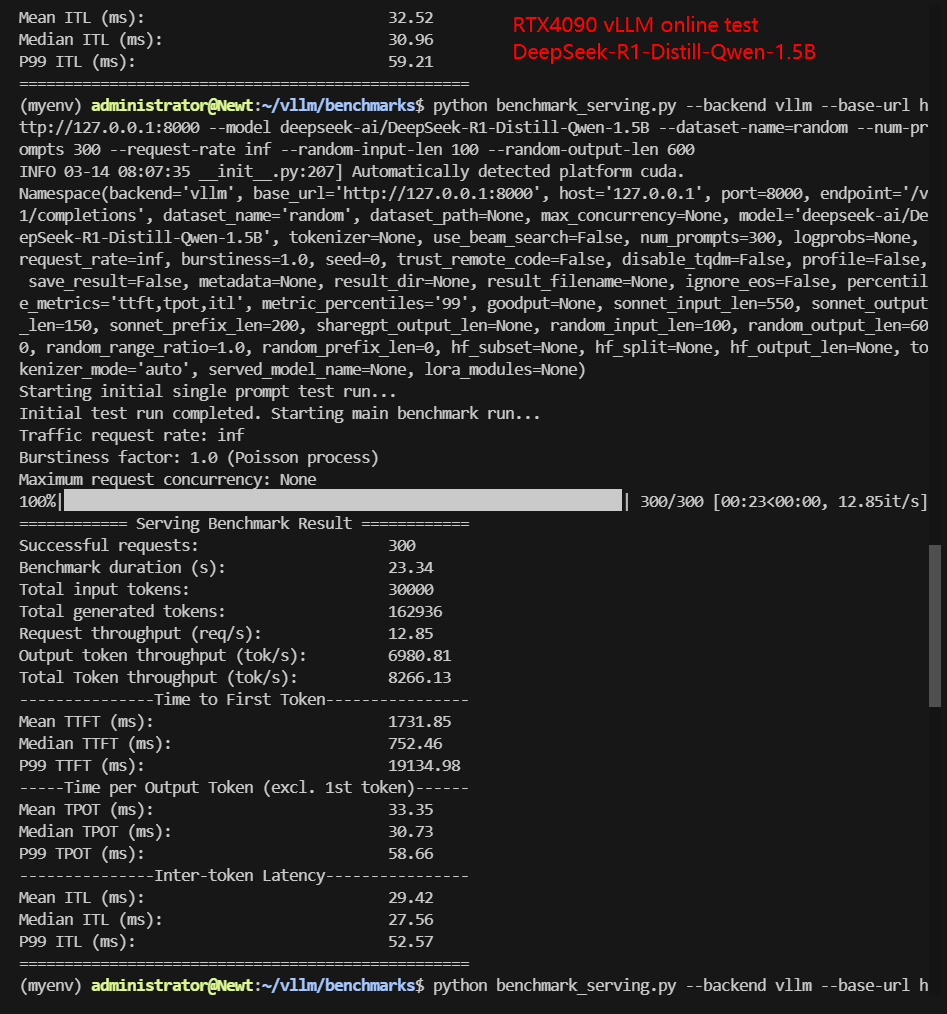
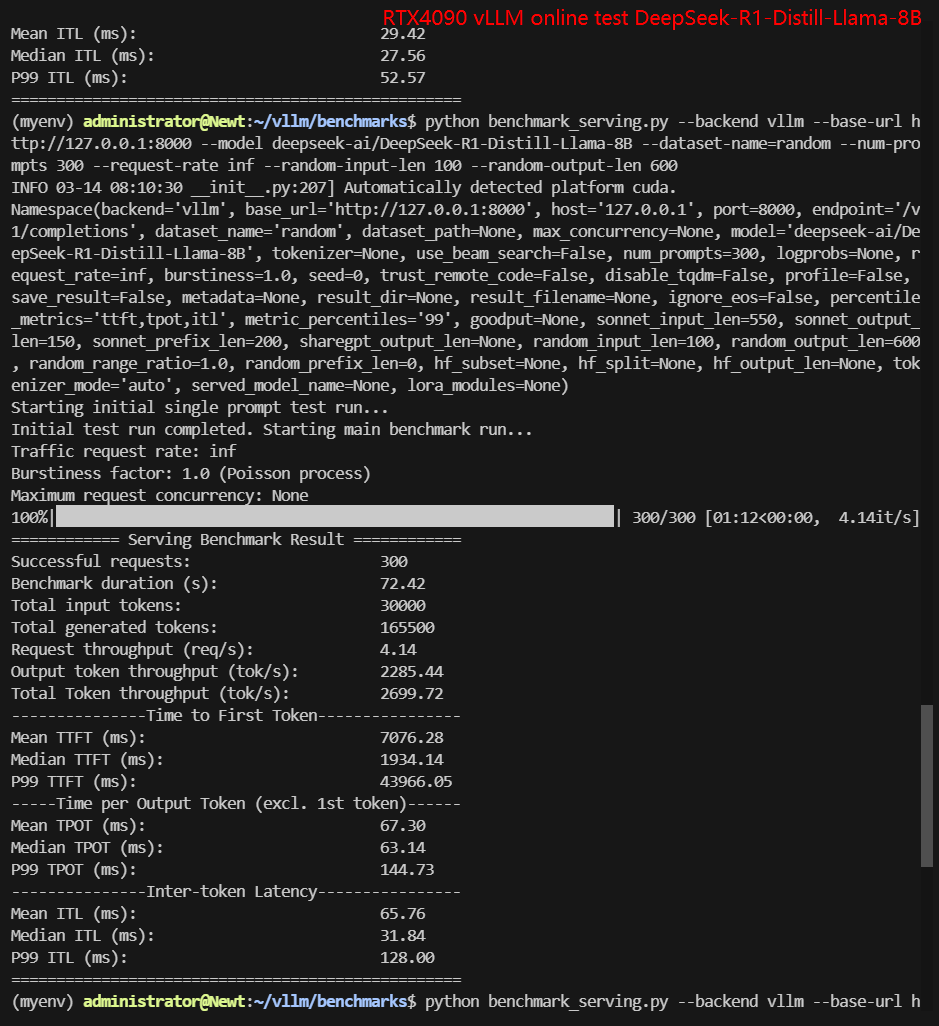
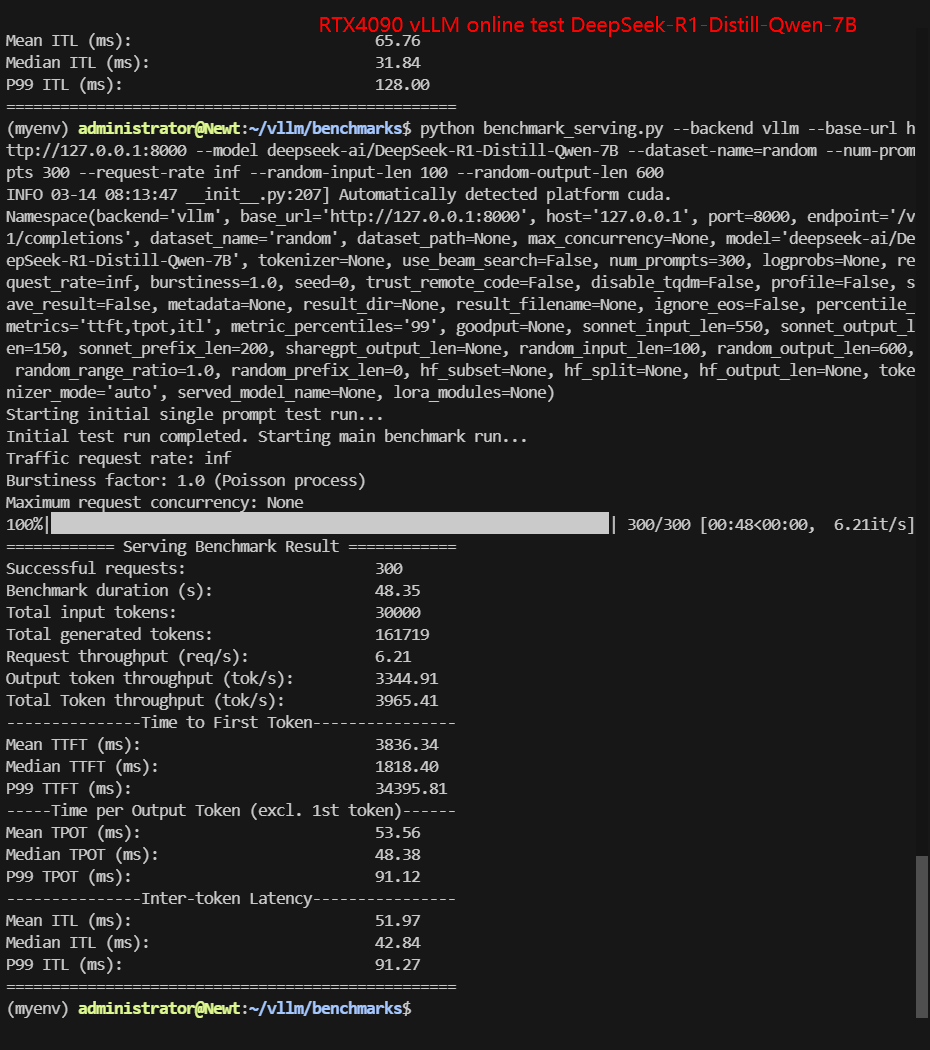
RTX4090 Online Benchmark Results Display
| Models | Qwen2.5-3B-Instruct | Qwen2.5-VL-7B-Instruct | gemma-2-9b-it | DeepSeek-R1-Distill-Qwen-1.5B | DeepSeek-R1-Distill-Llama-8B | DeepSeek-R1-Distill-Qwen-7B |
|---|---|---|---|---|---|---|
| Quantification | 16 | 16 | 16 | 16 | 16 | 16 |
| Size(GB) | 6.2GB | 16.6GB | 18.5GB | 3.6GB | 16.1GB | 15.2GB |
| Backend/Platform | vLLM | vLLM | vLLM | vLLM | vLLM | vLLM |
| CPU Rate | 2.8% | 2.5% | 1.6% | 3.0% | 2.5% | 2.6% |
| RAM Rate | 3.9% | 5.2% | 4.3% | 4.8% | 3.7% | 4.9% |
| GPU vRAM Rate | 89% | 94% | 84% | 89% | 90% | 90% |
| GPU UTL | 80% | 88%-92% | 94% | 46%-78% | 82%-93% | 75%-100% |
| Request (req/s) | 10.59 | 7.54 | 13.58 | 12.85 | 4.14 | 6.21 |
| Total Duration | 28s | 39s | 22s | 23s | 1min12s | 48s |
| Input (tokens/s) | 1058.64 | 753.84 | 1357.62 | 1285.32 | 414.28 | 620.5 |
| Output (tokens/s) | 5921.67 | 3255.45 | 305.51 | 6980.81 | 2285.44 | 3344.91 |
| Total Throughput (tokens/s) | 6980.31 | 4009.29 | 1663.13 | 8266.13 | 2699.72 | 3965.41 |
✅ Key Takeaways:
- 4090 is best suited for LLMs under 8B. Performance degrades significantly for larger models like Gemma-9B, likely due to VRAM limitations.
- Online inference dynamically adjusts performance.
- Total throughput is lower than offline tests due to auto-optimization.
- Latency is reduced for most models, but output token rate is not as expected.
Data Item Explanation in the Table:
- Quantization: The number of quantization bits. This test uses 16 bits, a full-blooded model.
- Size (GB): Model size in GB.
- Backend: The inference backend used. In this test, vLLM is used.
- CPU Rate: CPU usage rate.
- RAM Rate: Memory usage rate.
- GPU vRAM: GPU memory usage.
- GPU UTL: GPU utilization.
- Request Numbers: The number of requests processed per second.
- Total Duration: The total time to complete all requests.
- Input (tokens/s): The number of input tokens processed per second.
- Output (tokens/s): The number of output tokens generated per second.
- Total Throughput (tokens/s): The total number of tokens processed per second (input + output).
Performance Analysis: Why Does Online Inference Differ?
The RTX 4090 vLLM online benchmark reveals that vLLM might prioritize latency over total output. Here’s why:
1. VRAM Bottlenecks on Larger Models
- Gemma-9B’s low throughput suggests VRAM is insufficient.
- Llama-8B and Qwen-7B suffer from similar issues.
2. vLLM Optimization Adjusts Output Dynamically
- Online testing reduces output tokens if GPU utilization is too high.
- This ensures faster response times at the cost of lower throughput.
- Models that used close to 100% GPU VRAM in offline mode saw adjustments in online tests.
3. Trade-offs Between Latency and Throughput
- DeepSeek-R1-Distill-1.5B had minimal latency impact.
- Larger models struggled, likely due to how vLLM manages token output.
Best LLMs for RTX 4090: Recommendations
Based on vLLM benchmark results, RTX 4090 is best suited for models under 8B.
- Best Performance: DeepSeek-R1-Distill-1.5B
- Best Balance of Speed & Output: Qwen2.5-3B, DeepSeek-R1-Distill-Qwen-7B
- Avoid for Large Models: Gemma-9B struggles due to VRAM limits
For developers looking to deploy LLMs on RTX 4090, choosing a model under 8B ensures stable performance without vLLM’s auto-adjustments impacting output tokens.
Get Started with RTX 4090 Server Rental!
Interested in optimizing your LLM deployment? Check out vLLM server rental services or explore alternative GPUs for high-end AI inference.
Enterprise GPU Dedicated Server - RTX 4090
$ 409.00/mo
1mo3mo12mo24mo
Order Now- 256GB RAM
- Dual 18-Core E5-2697v4
- 240GB SSD + 2TB NVMe + 8TB SATA
- 100Mbps-1Gbps
- OS: Windows / Linux
- GPU: GeForce RTX 4090
- Microarchitecture: Ada Lovelace
- CUDA Cores: 16,384
- Tensor Cores: 512
- GPU Memory: 24 GB GDDR6X
- FP32 Performance: 82.6 TFLOPS
- Perfect for 3D rendering/modeling , CAD/ professional design, video editing, gaming, HPC, AI/deep learning.
Enterprise GPU Dedicated Server - A100
$ 639.00/mo
1mo3mo12mo24mo
Order Now- 256GB RAM
- Dual 18-Core E5-2697v4
- 240GB SSD + 2TB NVMe + 8TB SATA
- 100Mbps-1Gbps
- OS: Windows / Linux
- GPU: Nvidia A100
- Microarchitecture: Ampere
- CUDA Cores: 6912
- Tensor Cores: 432
- GPU Memory: 40GB HBM2
- FP32 Performance: 19.5 TFLOPS
- Good alternativeto A800, H100, H800, L40. Support FP64 precision computation, large-scale inference/AI training/ML.etc
New Arrival
Enterprise GPU Dedicated Server - A100(80GB)
$ 1559.00/mo
1mo3mo12mo24mo
Order Now- 256GB RAM
- Dual 18-Core E5-2697v4
- 240GB SSD + 2TB NVMe + 8TB SATA
- 100Mbps-1Gbps
- OS: Windows / Linux
- GPU: Nvidia A100
- Microarchitecture: Ampere
- CUDA Cores: 6912
- Tensor Cores: 432
- GPU Memory: 80GB HBM2e
- FP32 Performance: 19.5 TFLOPS
Enterprise GPU Dedicated Server - H100
$ 2099.00/mo
1mo3mo12mo24mo
Order Now- 256GB RAM
- Dual 18-Core E5-2697v4
- 240GB SSD + 2TB NVMe + 8TB SATA
- 100Mbps-1Gbps
- OS: Windows / Linux
- GPU: Nvidia H100
- Microarchitecture: Hopper
- CUDA Cores: 14,592
- Tensor Cores: 456
- GPU Memory: 80GB HBM2e
- FP32 Performance: 183TFLOPS
Conclusion: Is RTX 4090 the Best Consumer GPU for vLLM?
If you're running Hugging Face LLMs on RTX 4090, vLLM optimizations make it a great choice for smaller models. However, for models 8B and larger, a higher VRAM GPU (e.g., A100, H100) is recommended.
This benchmark highlights RTX 4090's strengths in handling efficient LLM inference, making it ideal for developers, AI researchers, and vLLM server rentals.
Attachment: Video Recording of RTX4090 vLLM Benchmark
Video: RTX4090 vLLM Benchmark Online Test Hugging Face LLMs
Screenshot: RTX4090 vLLM benchmark offline results

Screenshot: RTX4090 vLLM benchmark online results
Tags:
RTX4090 Server Rental,vLLM benchmark, RTX 4090 LLM test, best LLM GPU, Hugging Face vLLM, AI inference RTX 4090, LLM GPU comparison, vLLM server rental, best GPU for AI inference, vLLM vs HF Transformers, DeepSeek LLM benchmark, AI performance tuning.